Your accounting numbers, finally making sense.
Clarity builds a clear dashboard of your business from your Xero data. Then it lets you ask your numbers questions in plain English and get an answer back.
A two-minute look at Clarity, drawn from the demo.
You have all the numbers. What do they mean?
Your accounts are full of figures. Revenue, margin, cash, who owes you what. Reading a real answer out of them takes time you do not have when you are running the business.
You've got all these numbers in front of you, what do they mean? This thing would have taken you quite a bit of time to do in Excel or ask an analyst to do.
Clarity does that reading for you, and shows its working so you can check it.
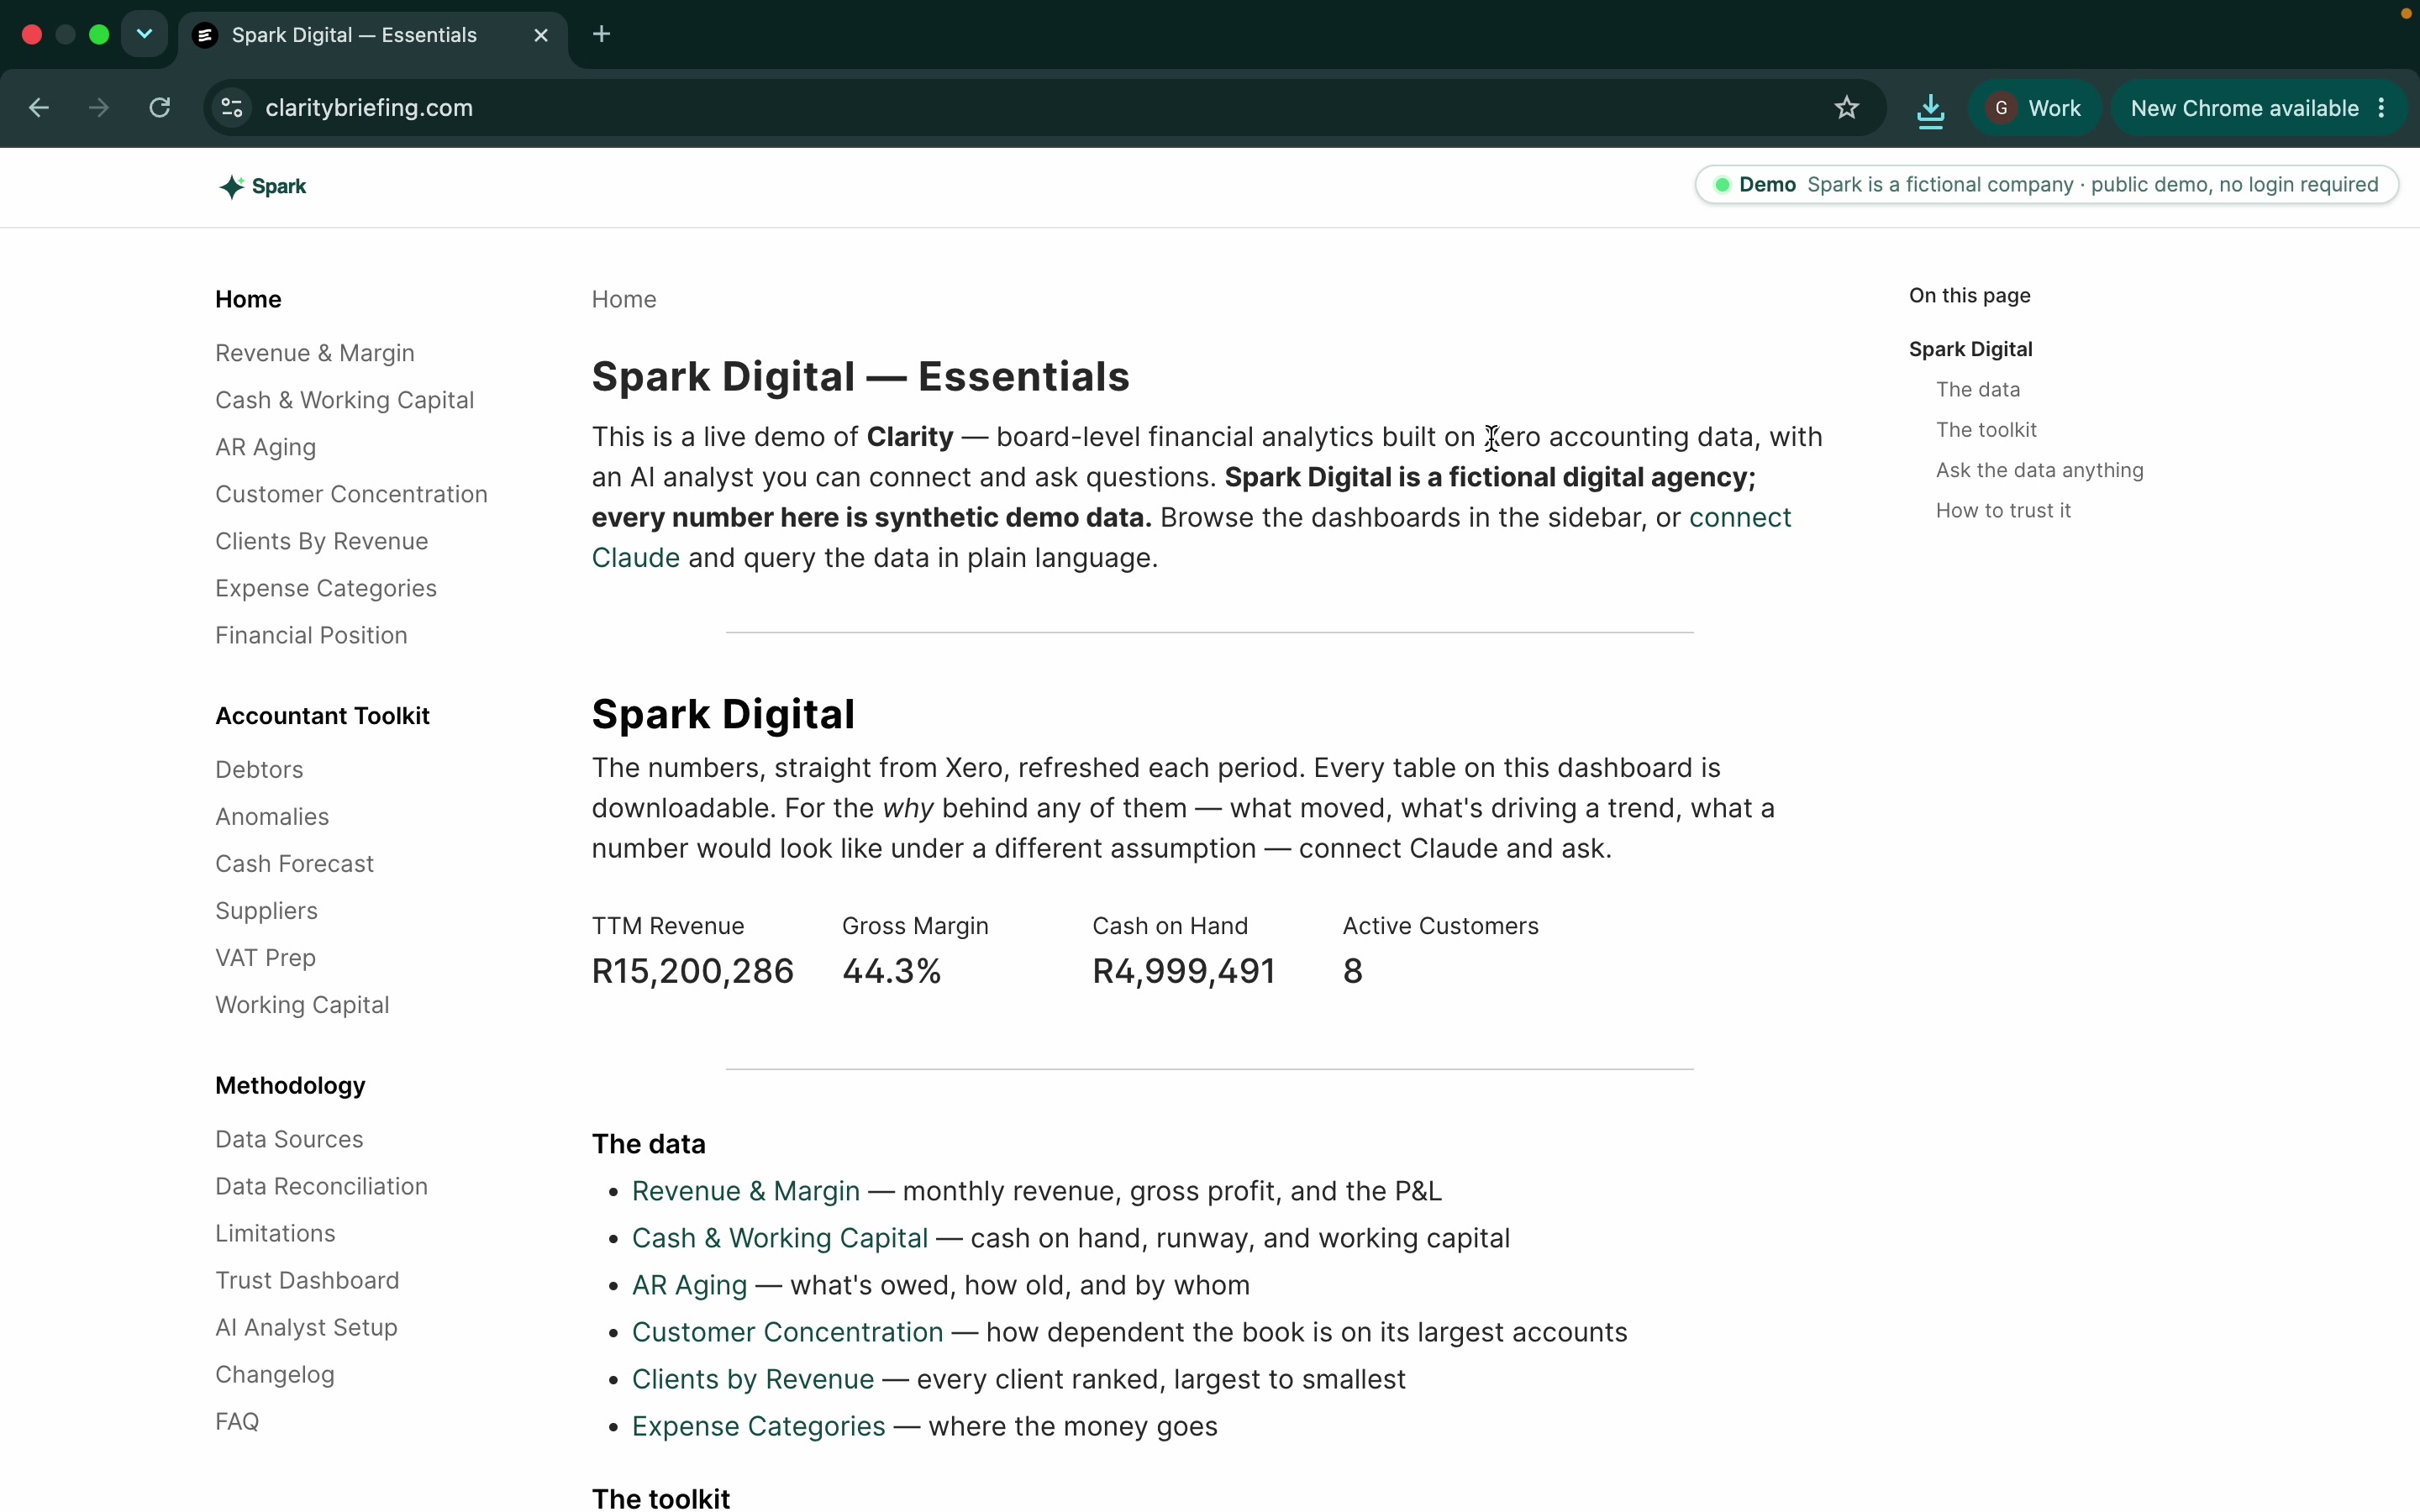
Two ways to see your data
Same Xero data, two views. A dashboard you read like a report, and an AI analyst you talk to when you want to dig into something.
Clarity exposes your financial data in two ways. The one is a dashboard, and the other is that it makes it available to your AI.
A number that looks like growth, but is not
In the demo, the marketing spend looked like it had tripled year on year. A real worry if you are paying the bills. So we asked Clarity what was behind it.
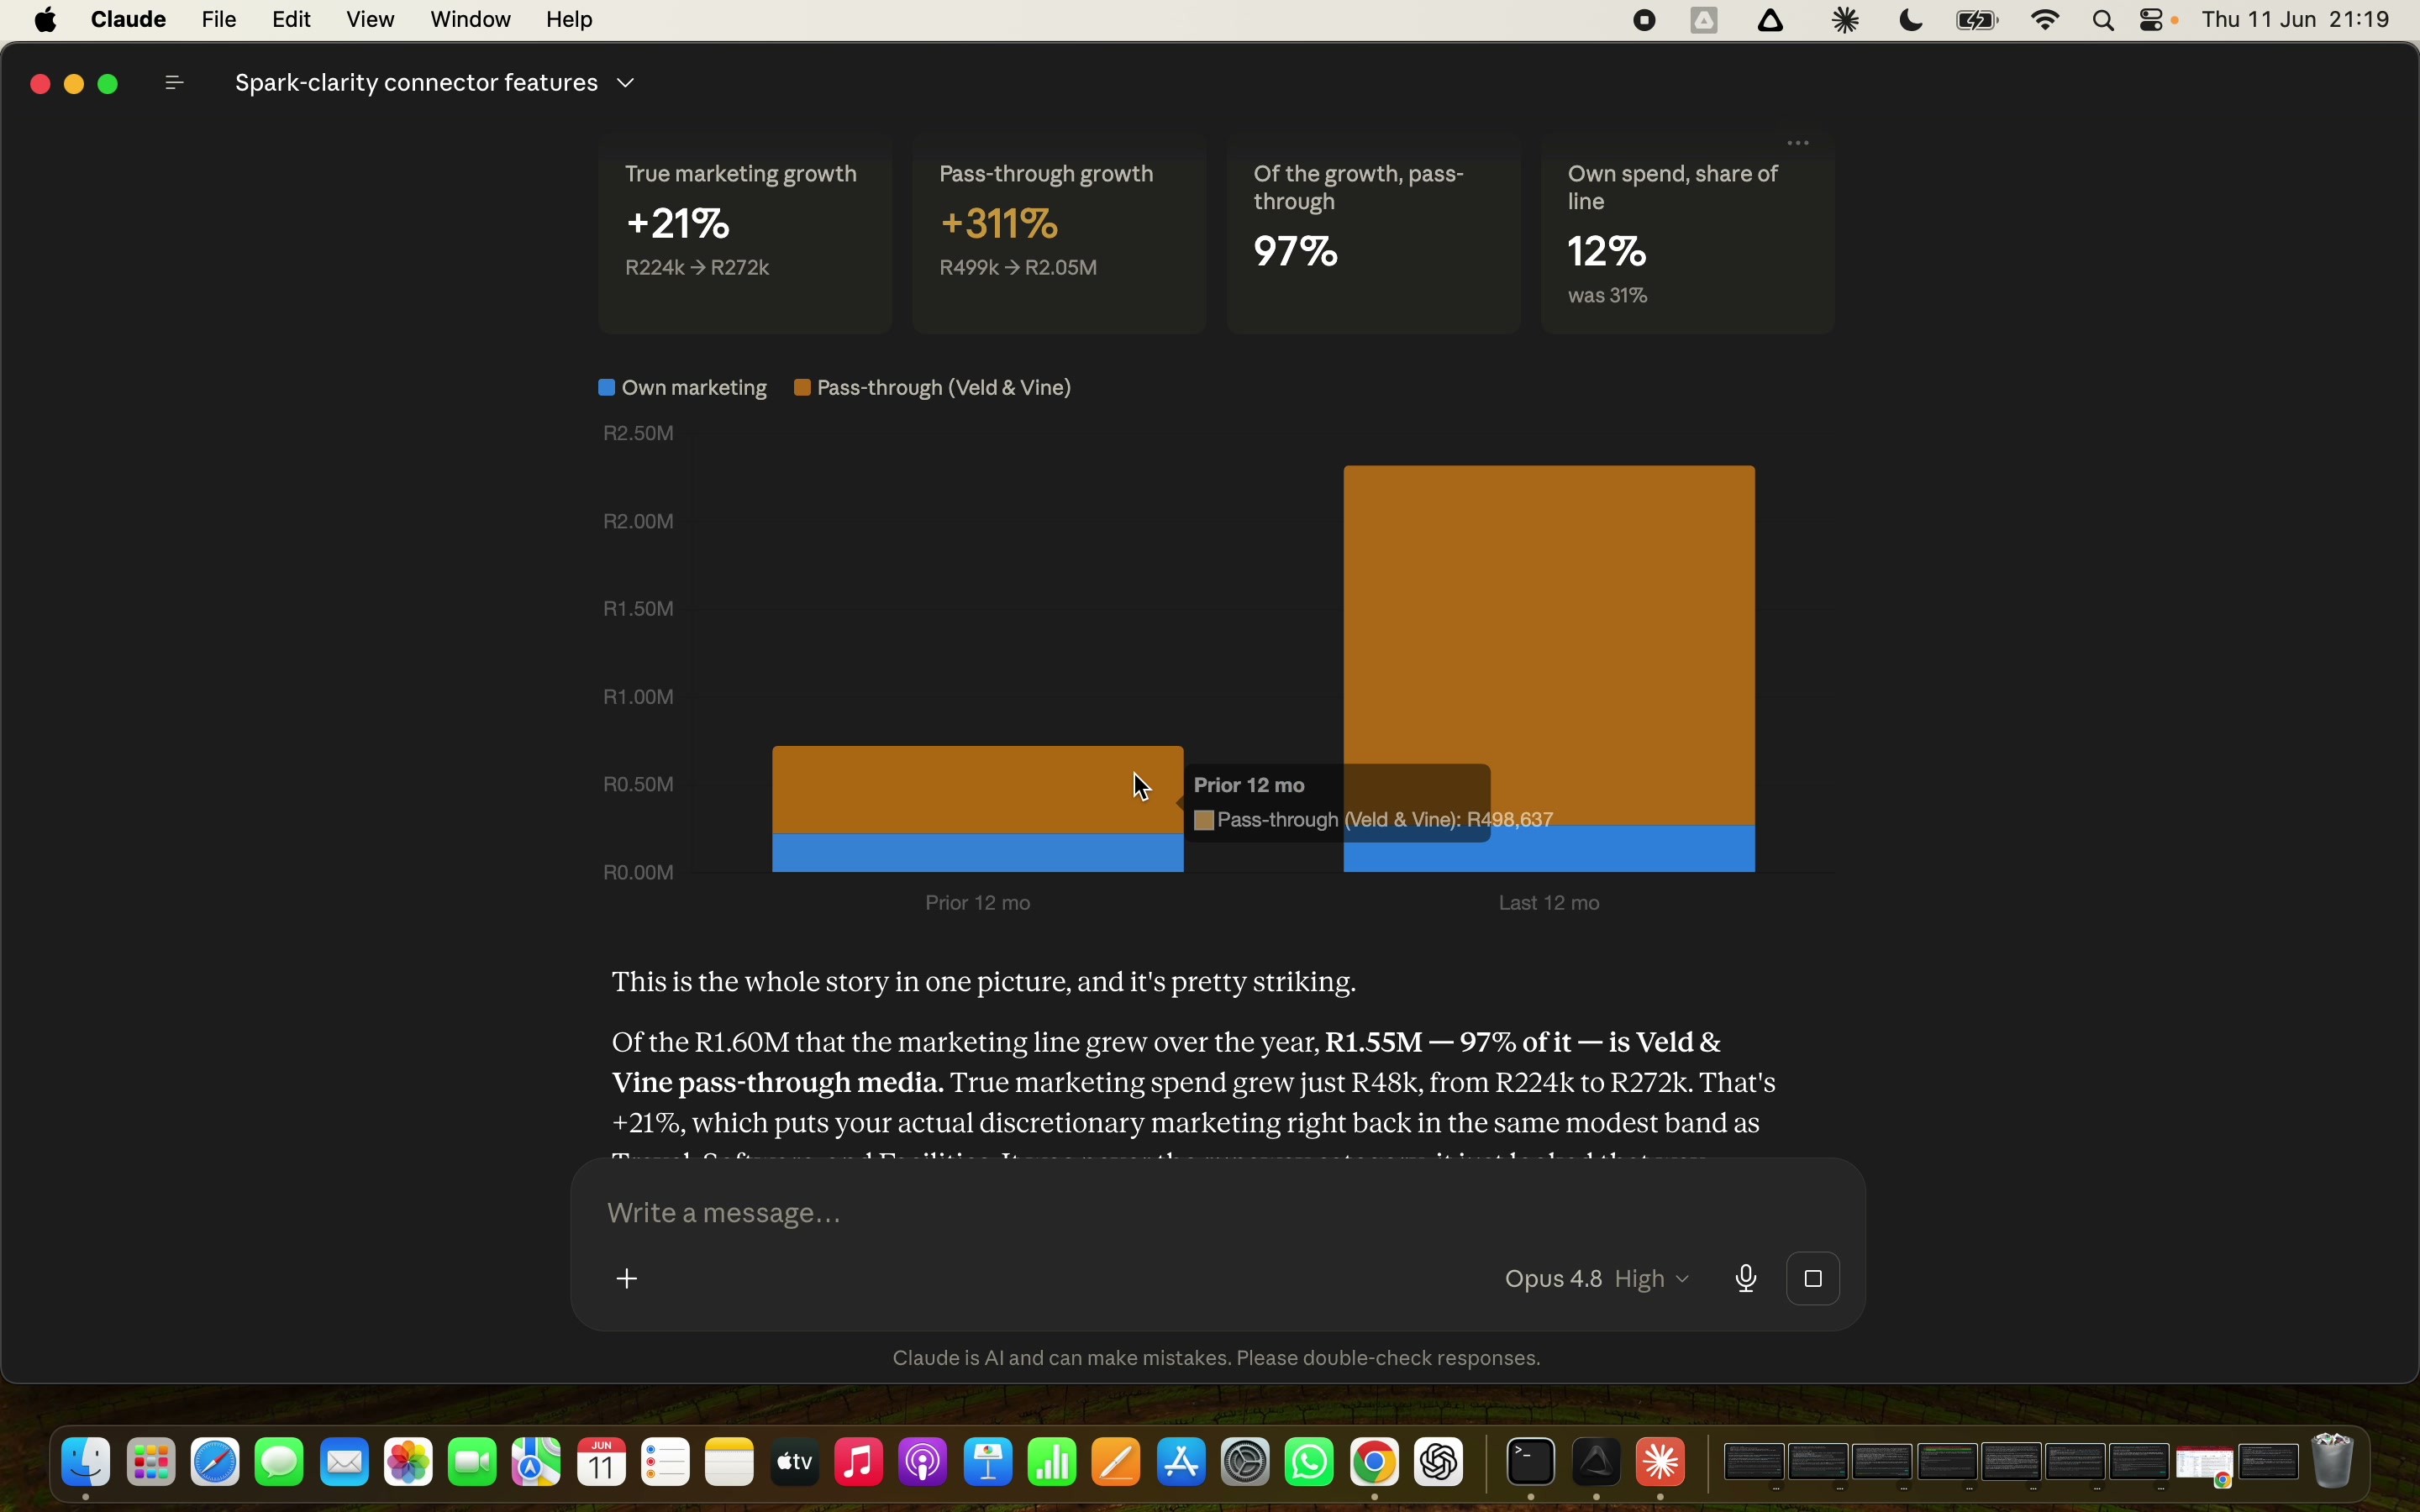
Almost all of the increase was money passing through for one client's media buying, not the firm's own spend. Strip that out and marketing was roughly flat. The real growth was about 21%.
Marketing tripled is actually an accounting artifact that's not real. This is the sort of thing that's really tricky to figure out on your own when you're busy running a business, and it doesn't pop out of your management accounts very easily.
What you get
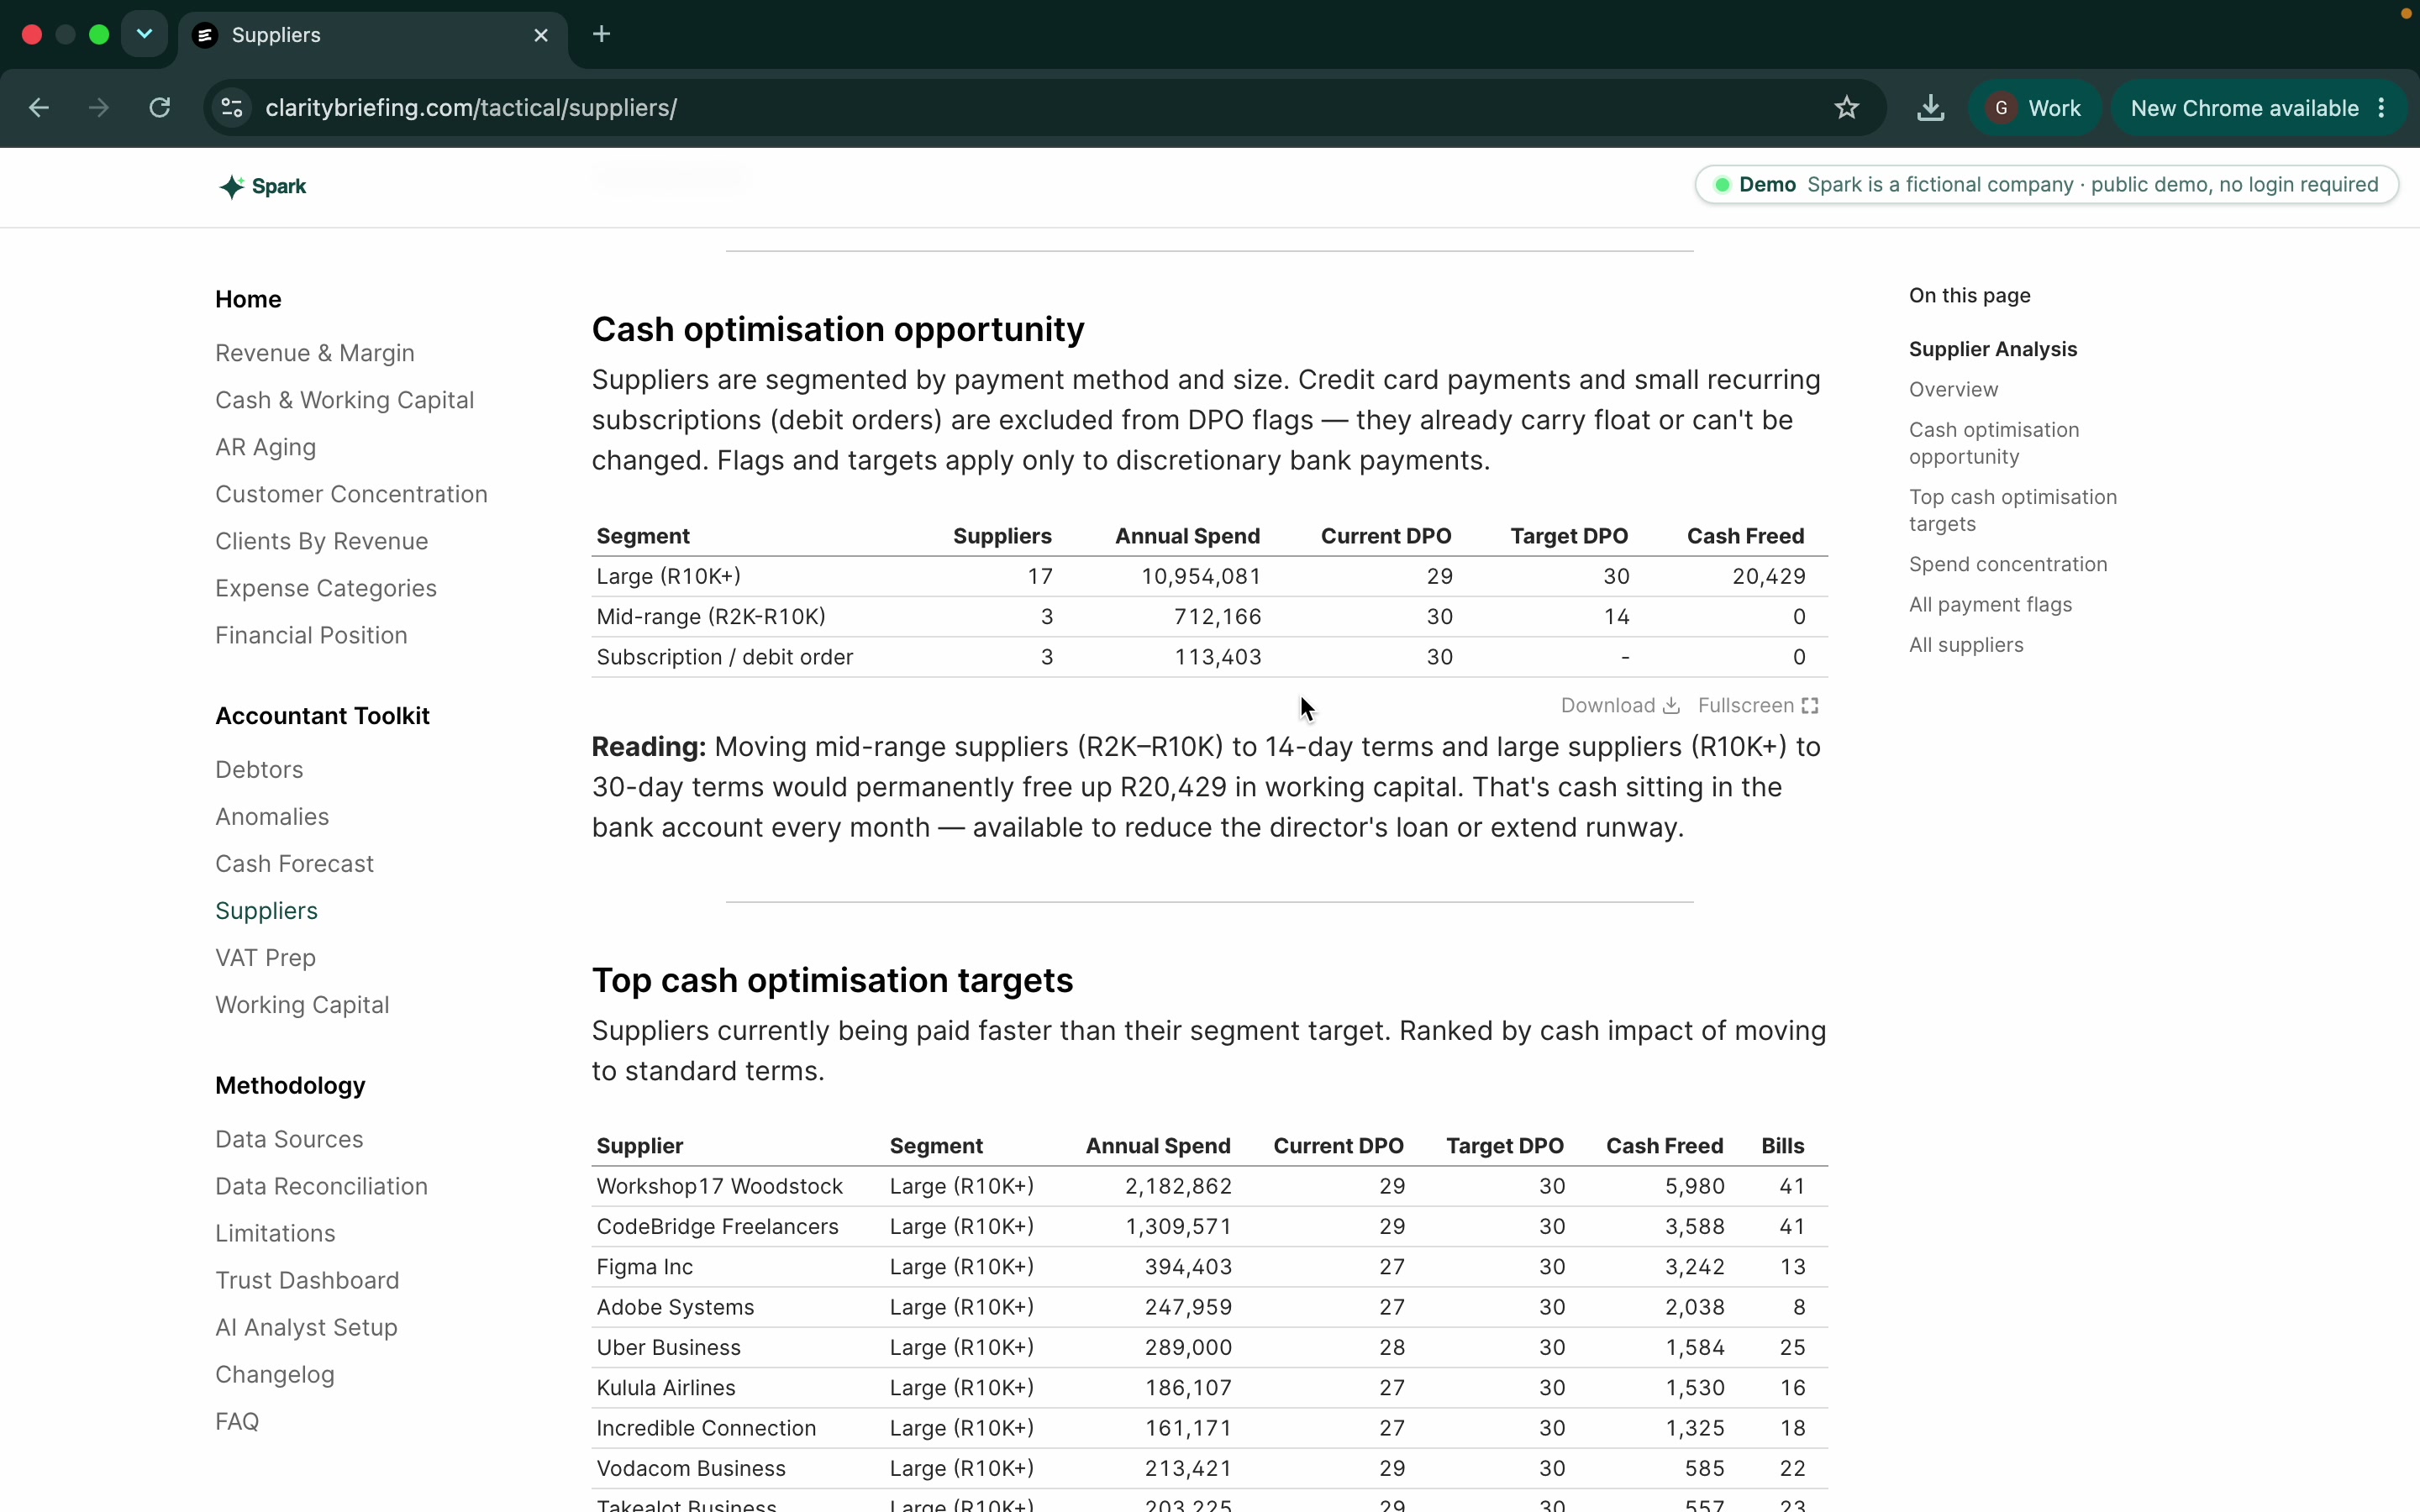
A board-level view of the business, plus an accountant's toolkit: a 13-week cash forecast, debtor patterns, supplier payment terms, anomaly flags, and VAT prep. Built once, refreshed every month-end.
A thing a lot of business owners wouldn't have at their fingertips.
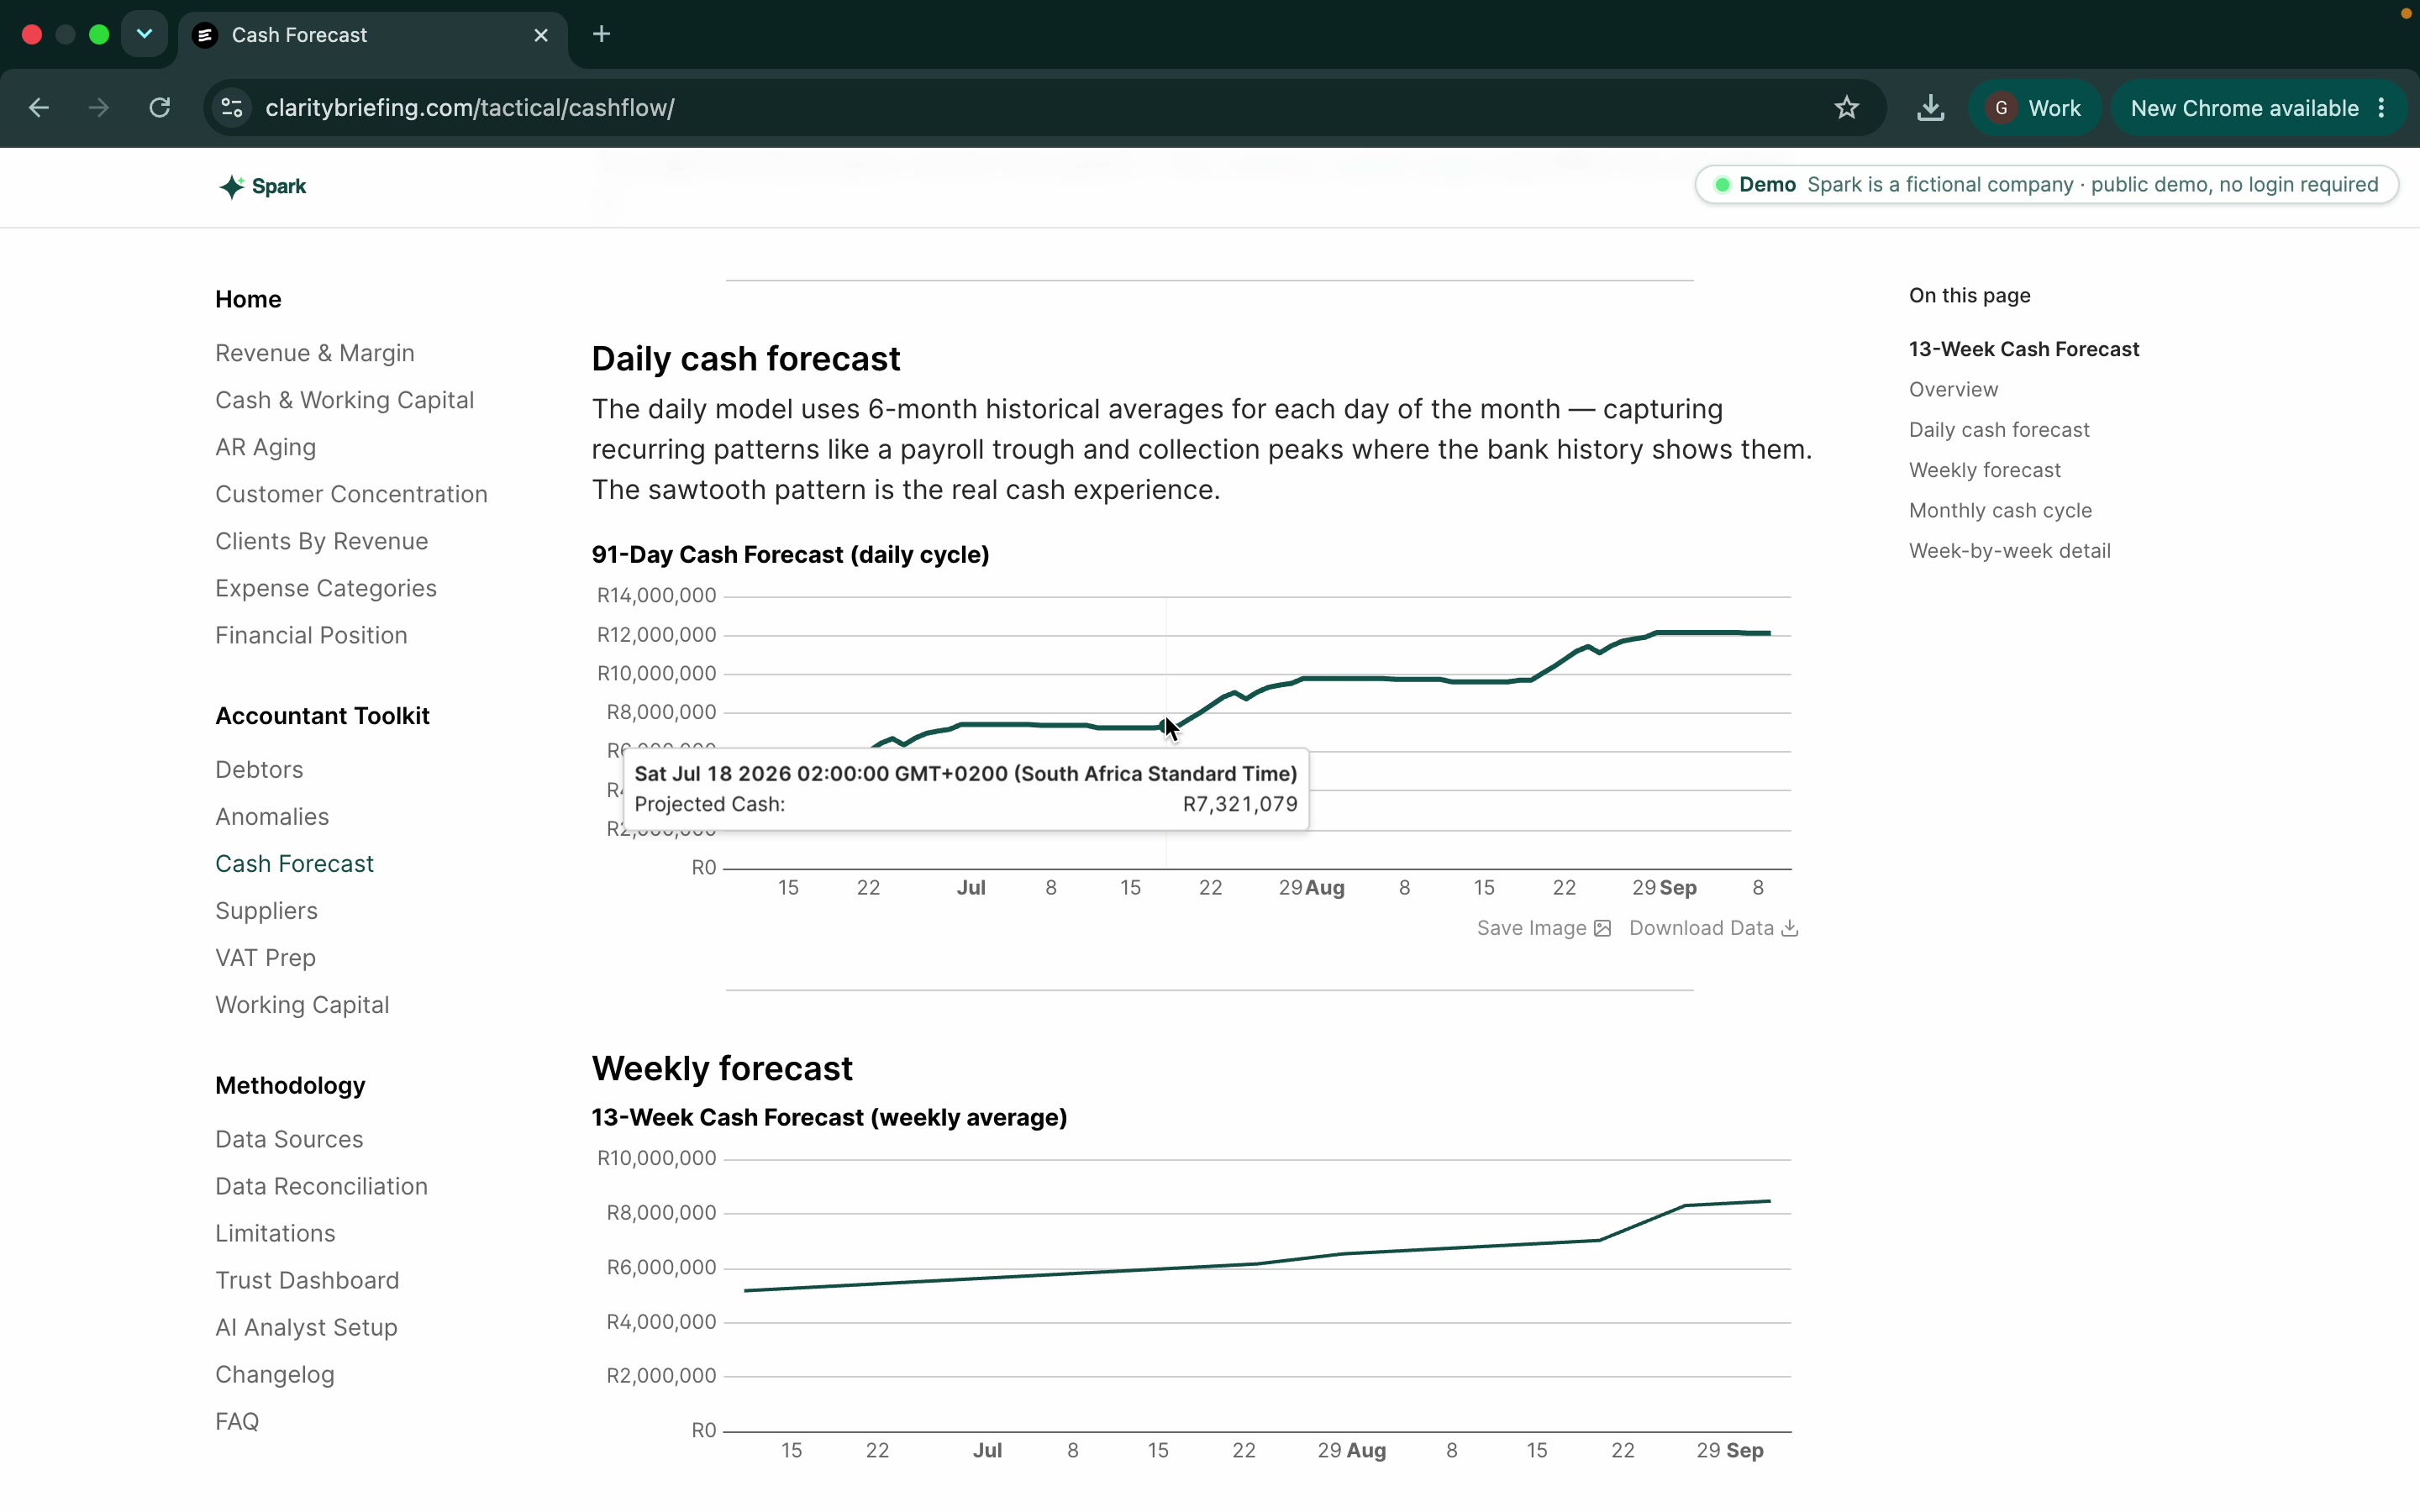
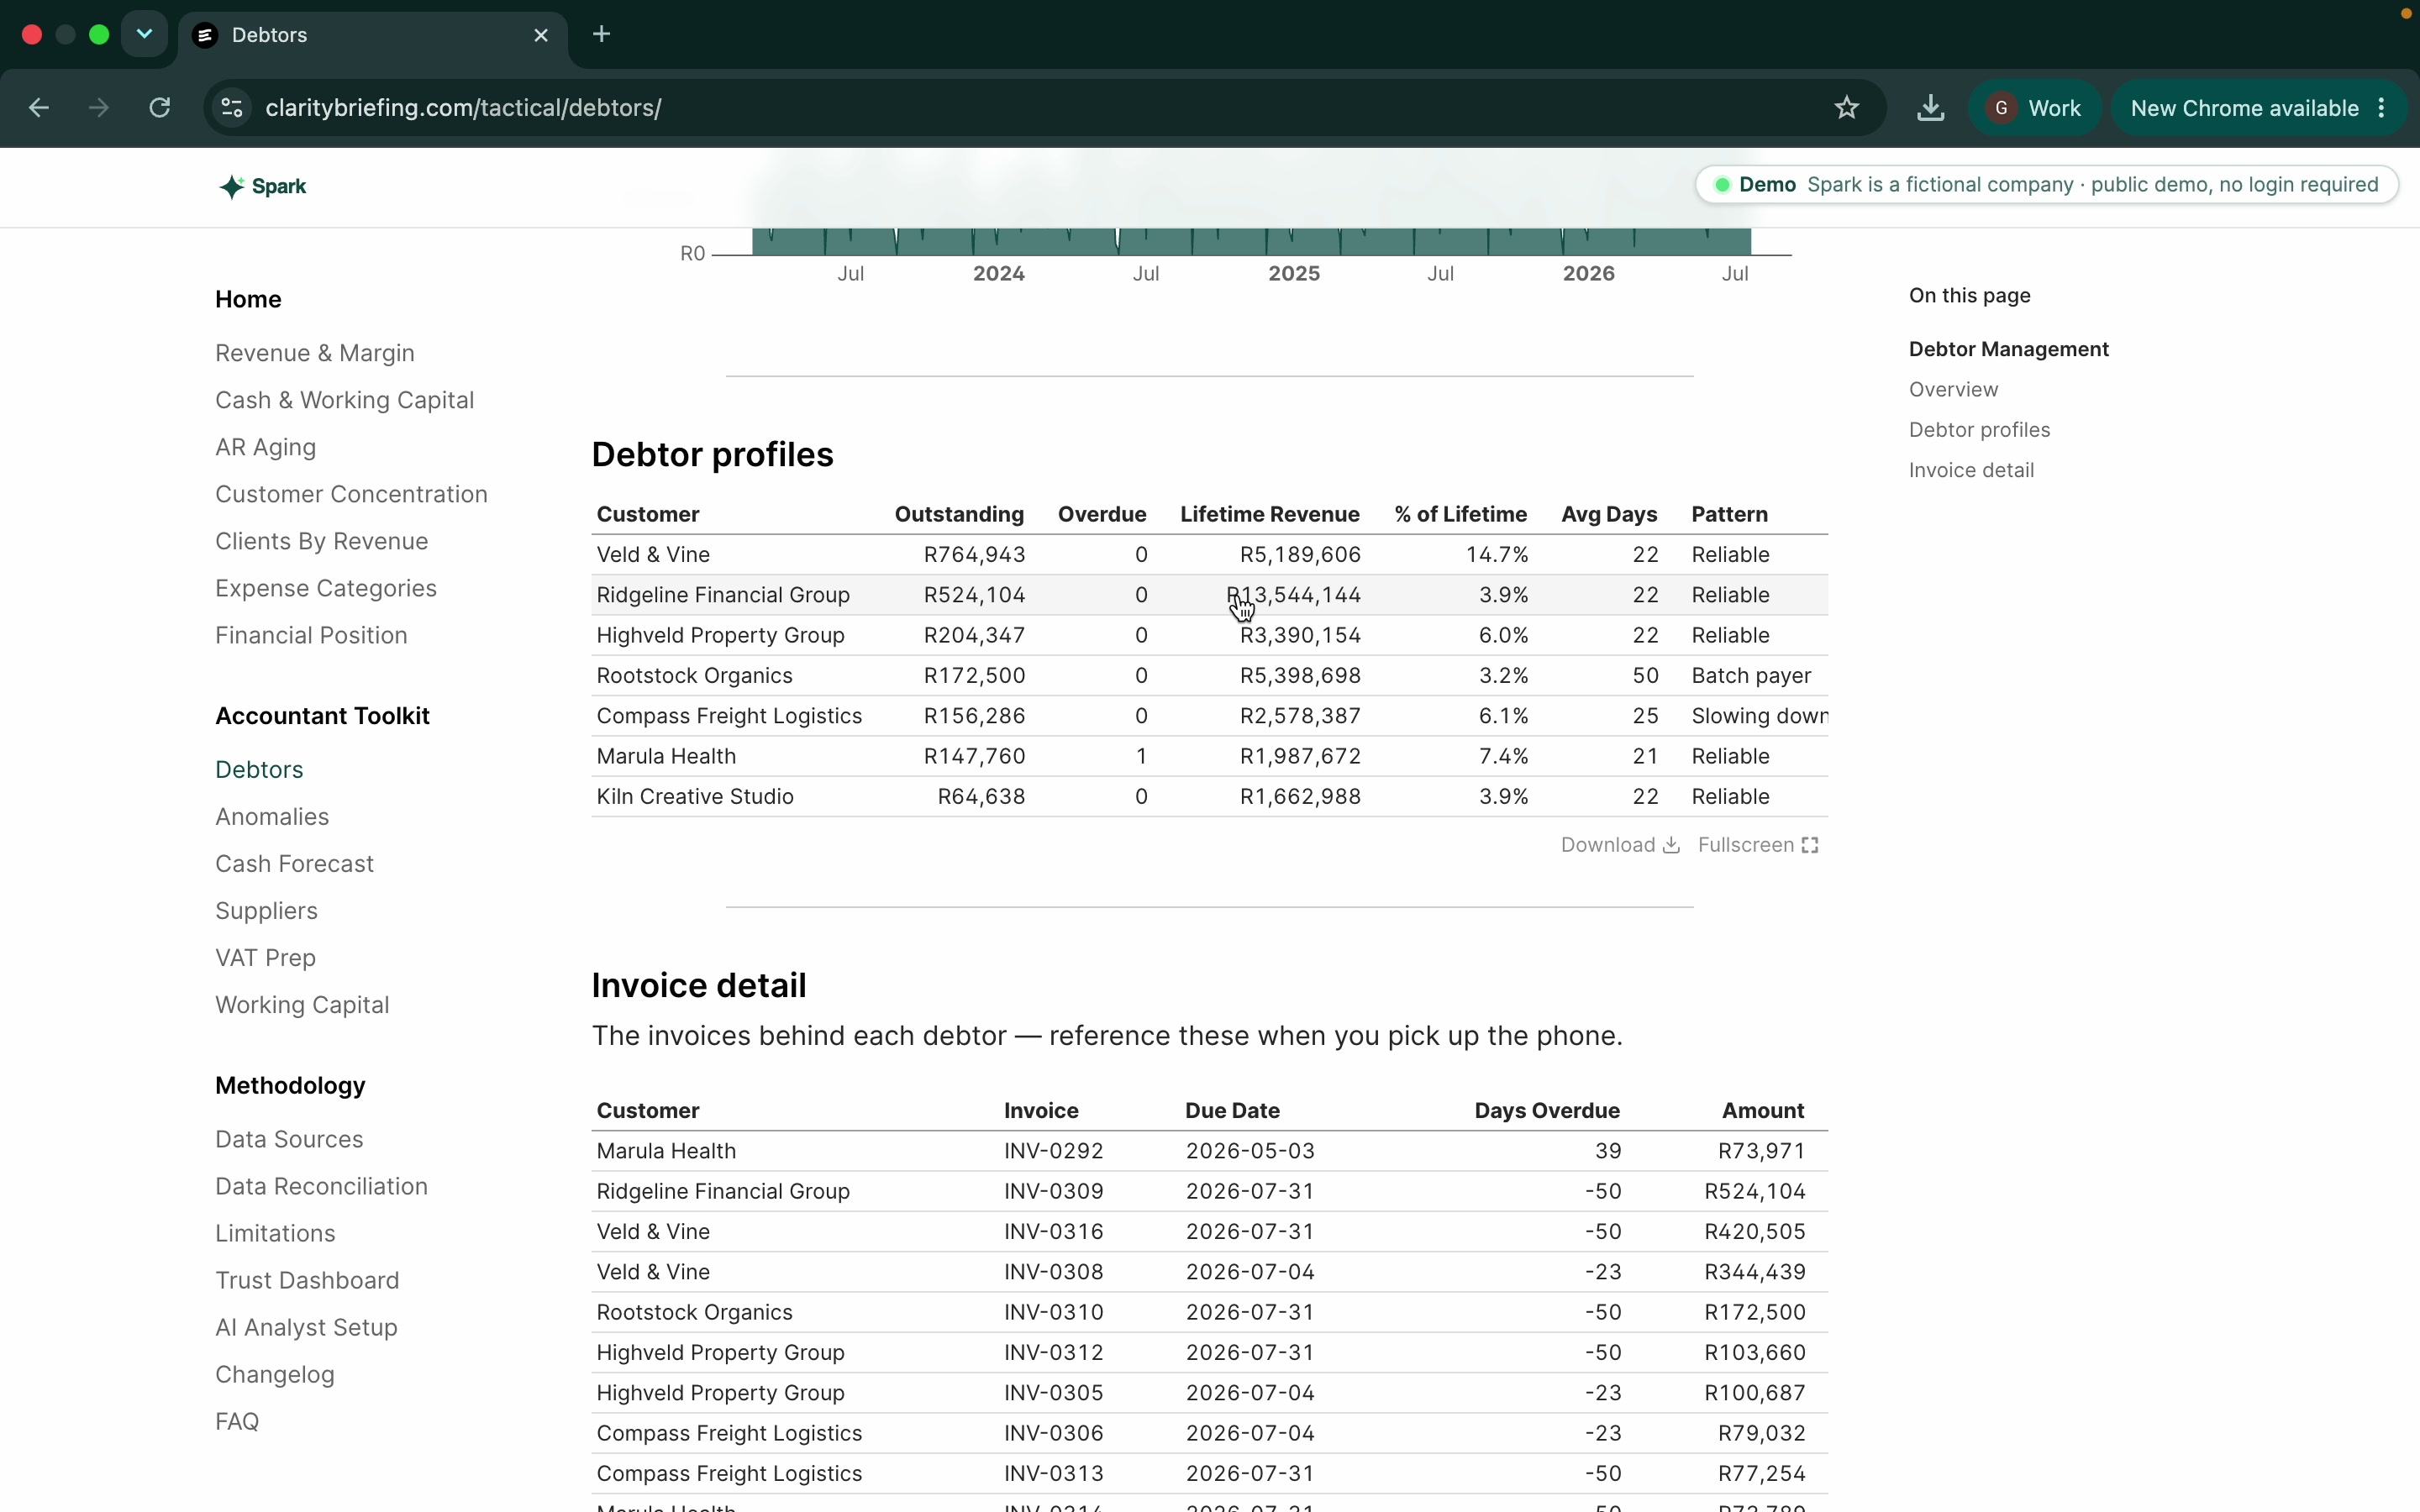
Watch the full walkthrough
About eleven minutes, end to end. The same demo business, from the dashboard through to asking the AI analyst questions and watching it show its working.
Now try it yourself
You have seen it work. Now open the live demo and play with it the way you would your own numbers. It runs on a fictional sample business, Spark Digital, so nothing here is a real client's books.
Browse the dashboards as you would a report. To use the AI analyst, connect Claude with the one connector link on the demo's own setup page, then start asking. A few questions worth trying:
- → Why did marketing triple?
- → How has gross margin moved, and what is driving it?
- → Which customers are slowest to pay, and what does that cost in cash?
How it works
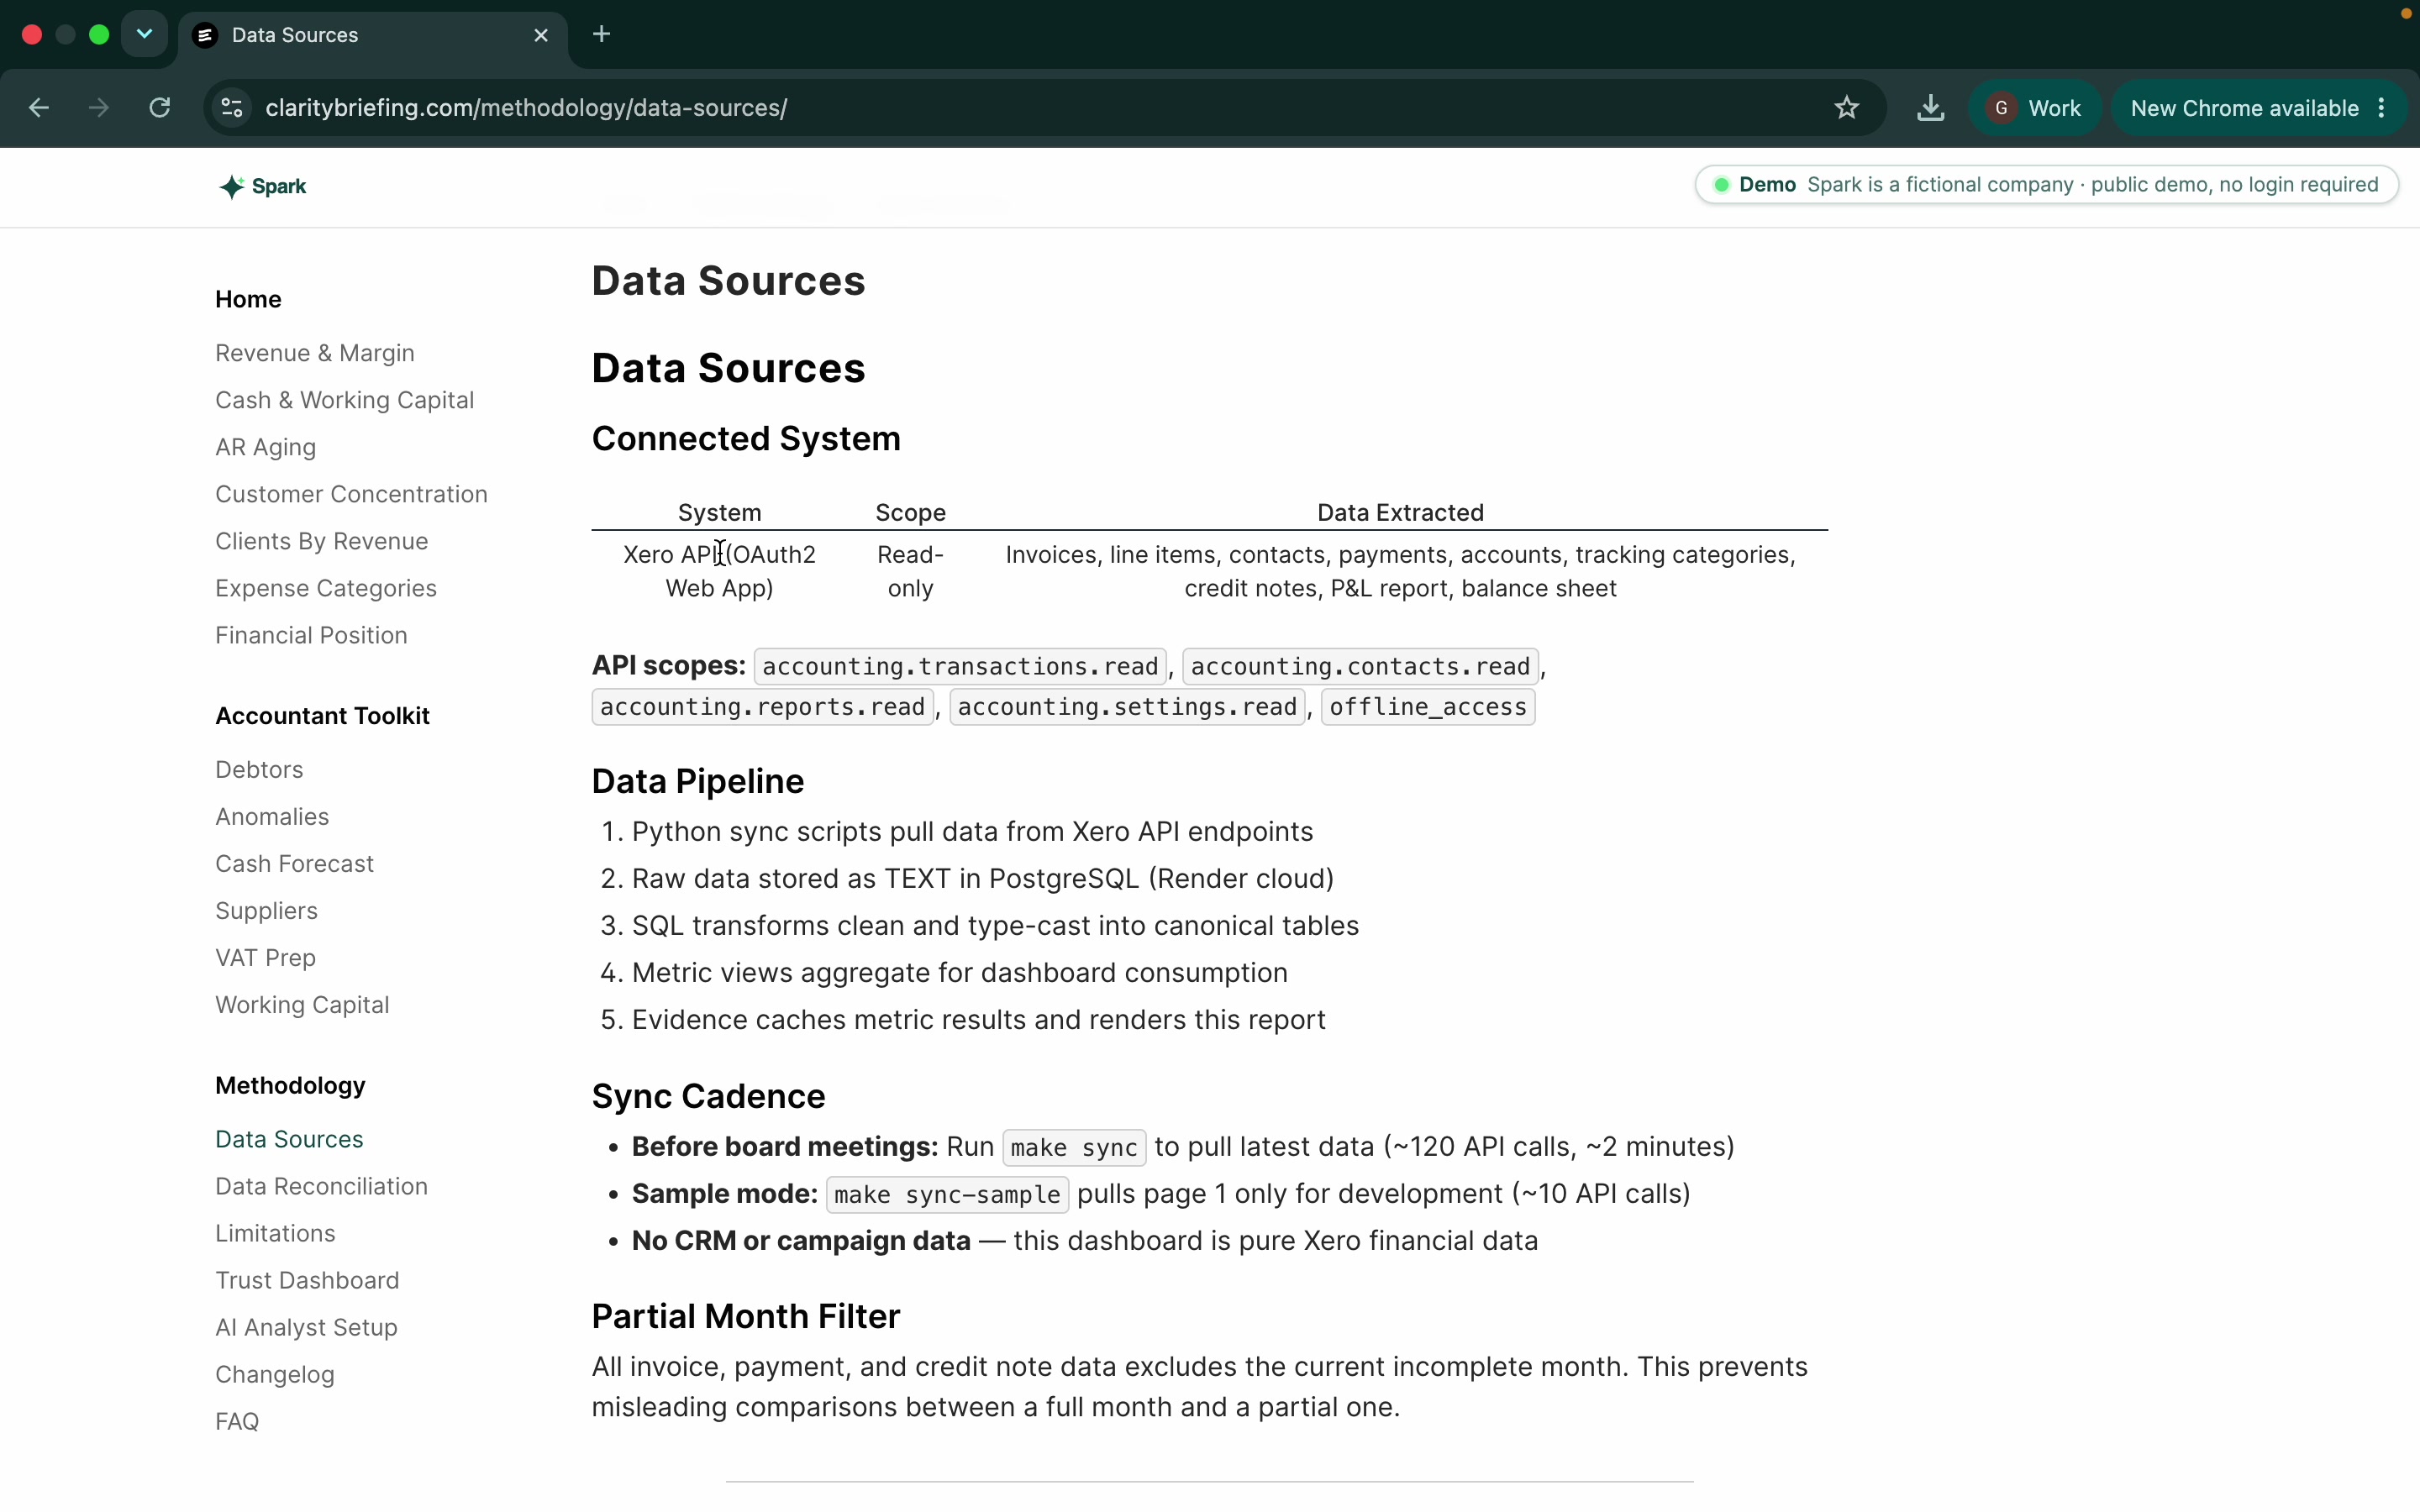
Clarity connects to Xero with read-only access and copies your data into its own environment. It never writes anything back to your accounts. When your books close each month, the dashboard refreshes.
We don't write anything to Xero, other than siphoning it off into our own environment.
Numbers you can trust
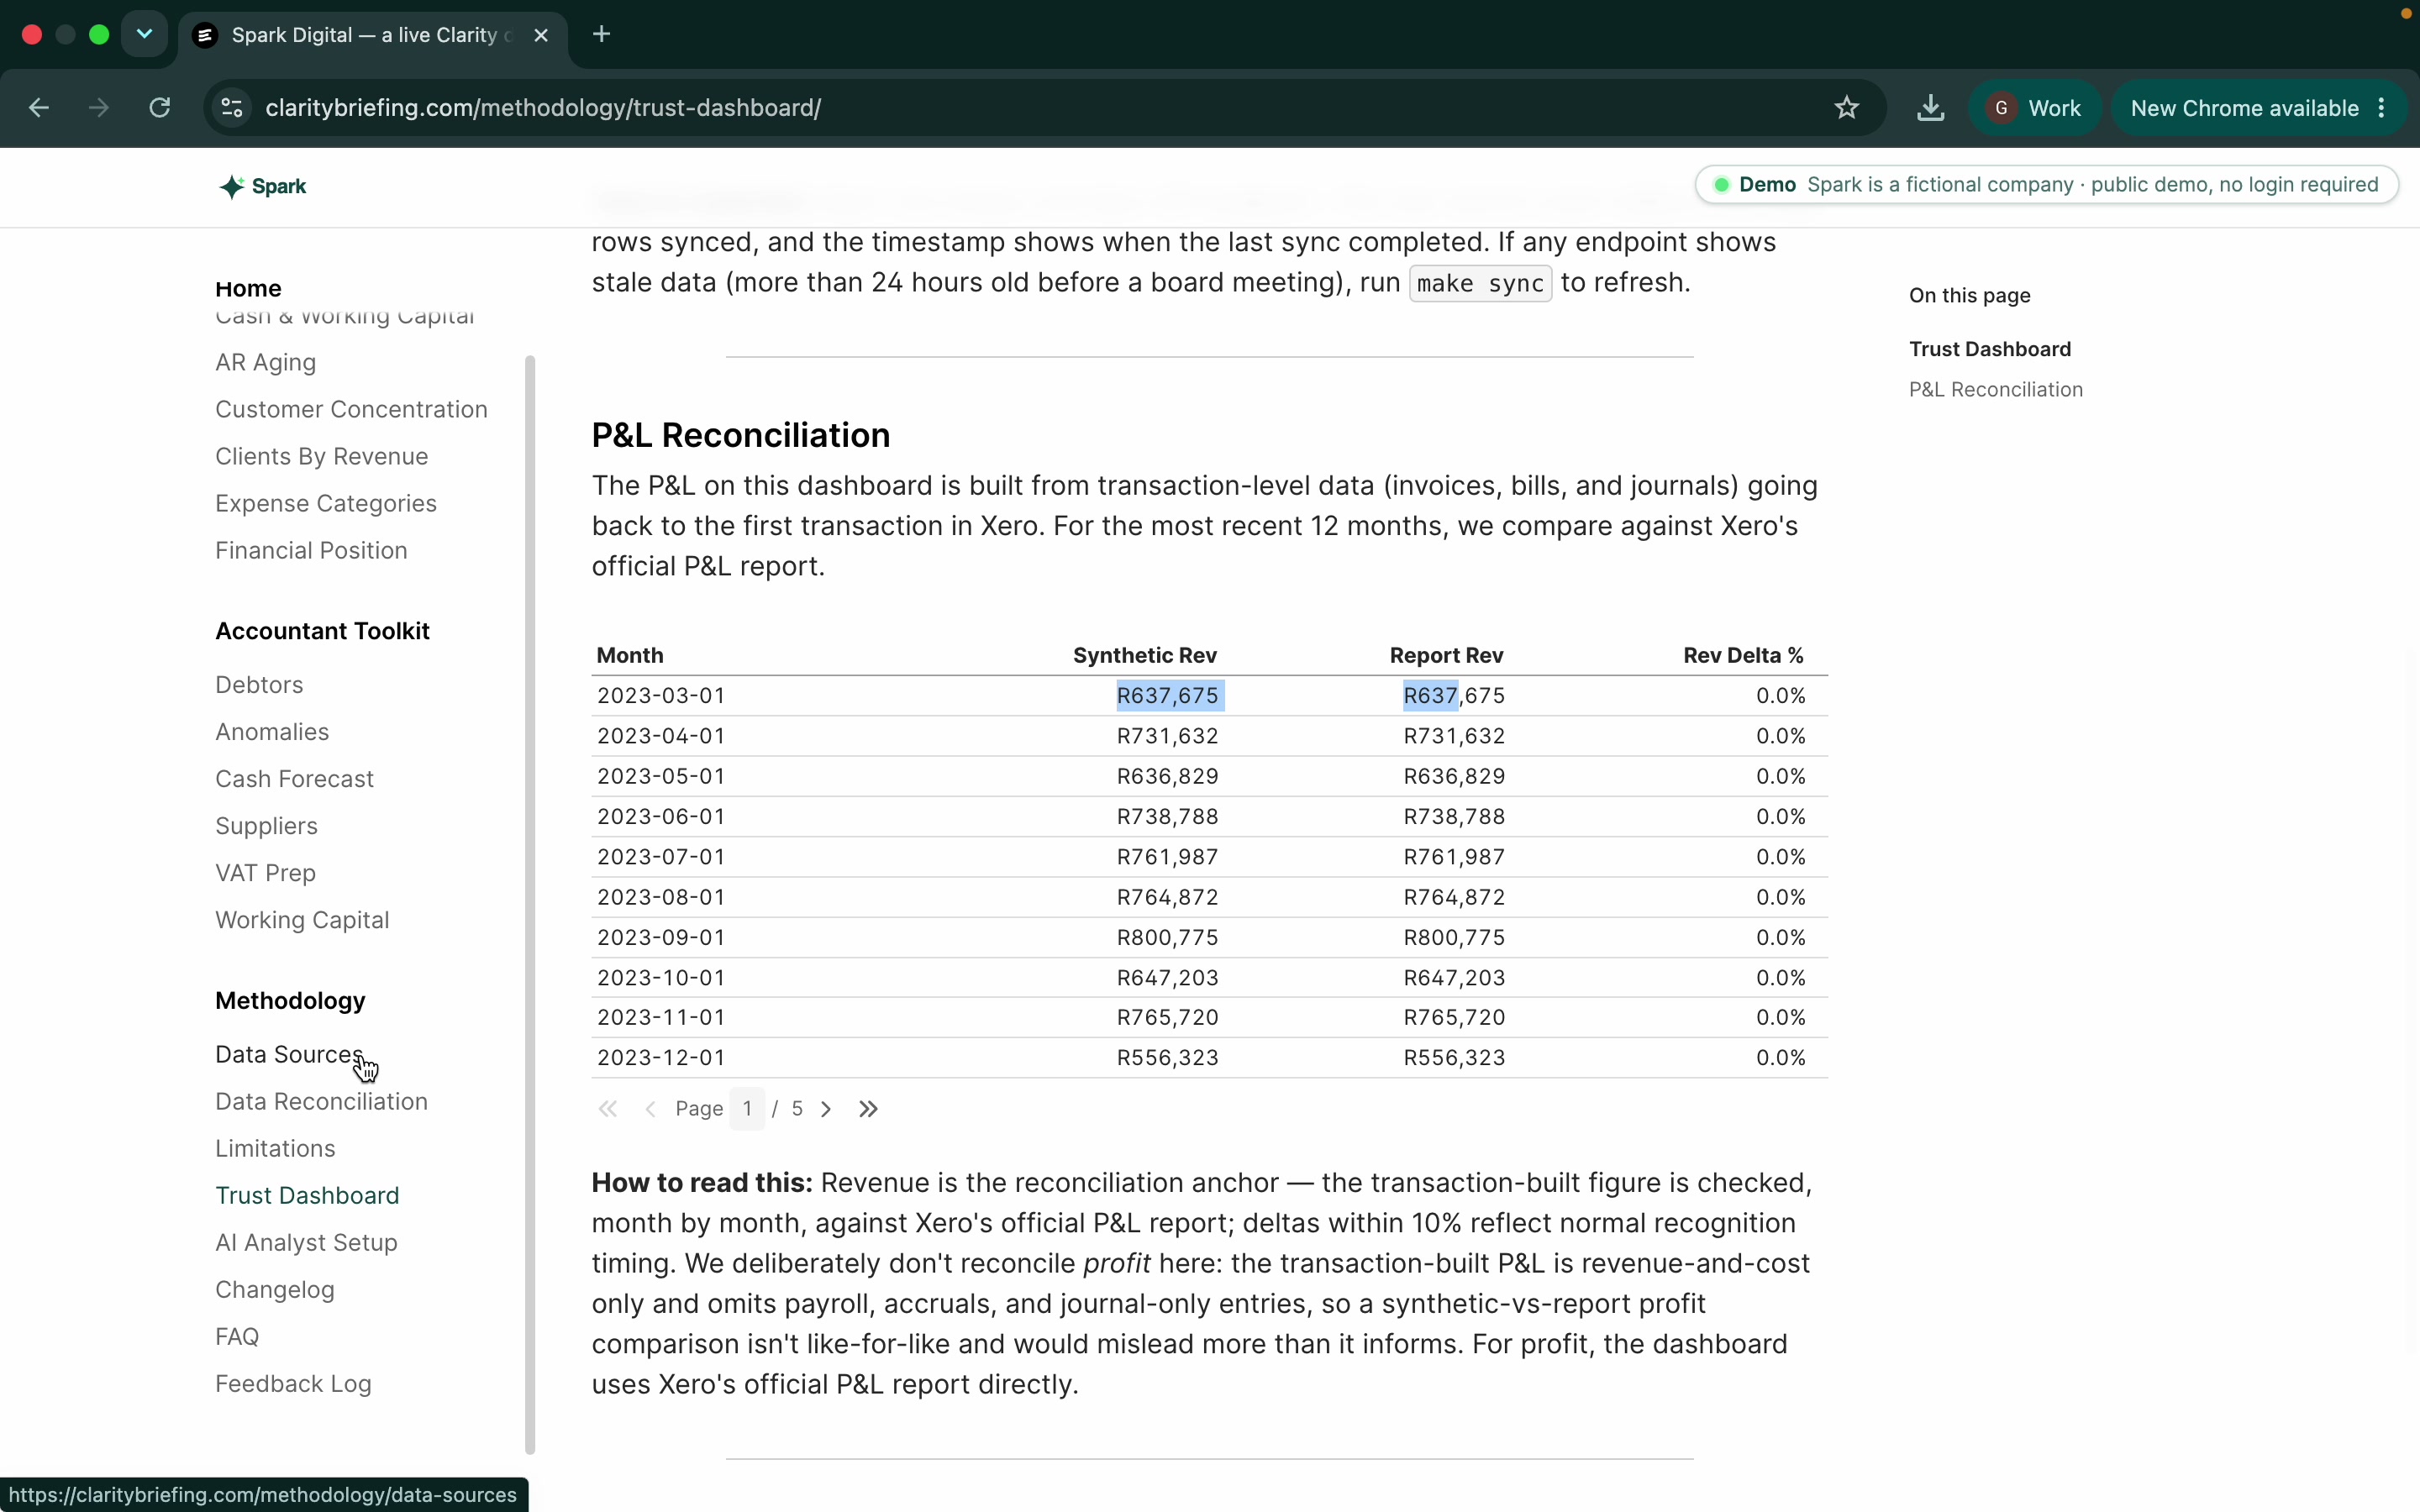
The figures on the dashboard are worked out with plain calculations on your data, not AI guesses. We reconcile revenue against Xero's own P&L report, and we show how fresh the data is.
All of the base data and the report data match. You've got no discrepancy, which gives you confidence that the numbers are right.
Connecting your AI is one link
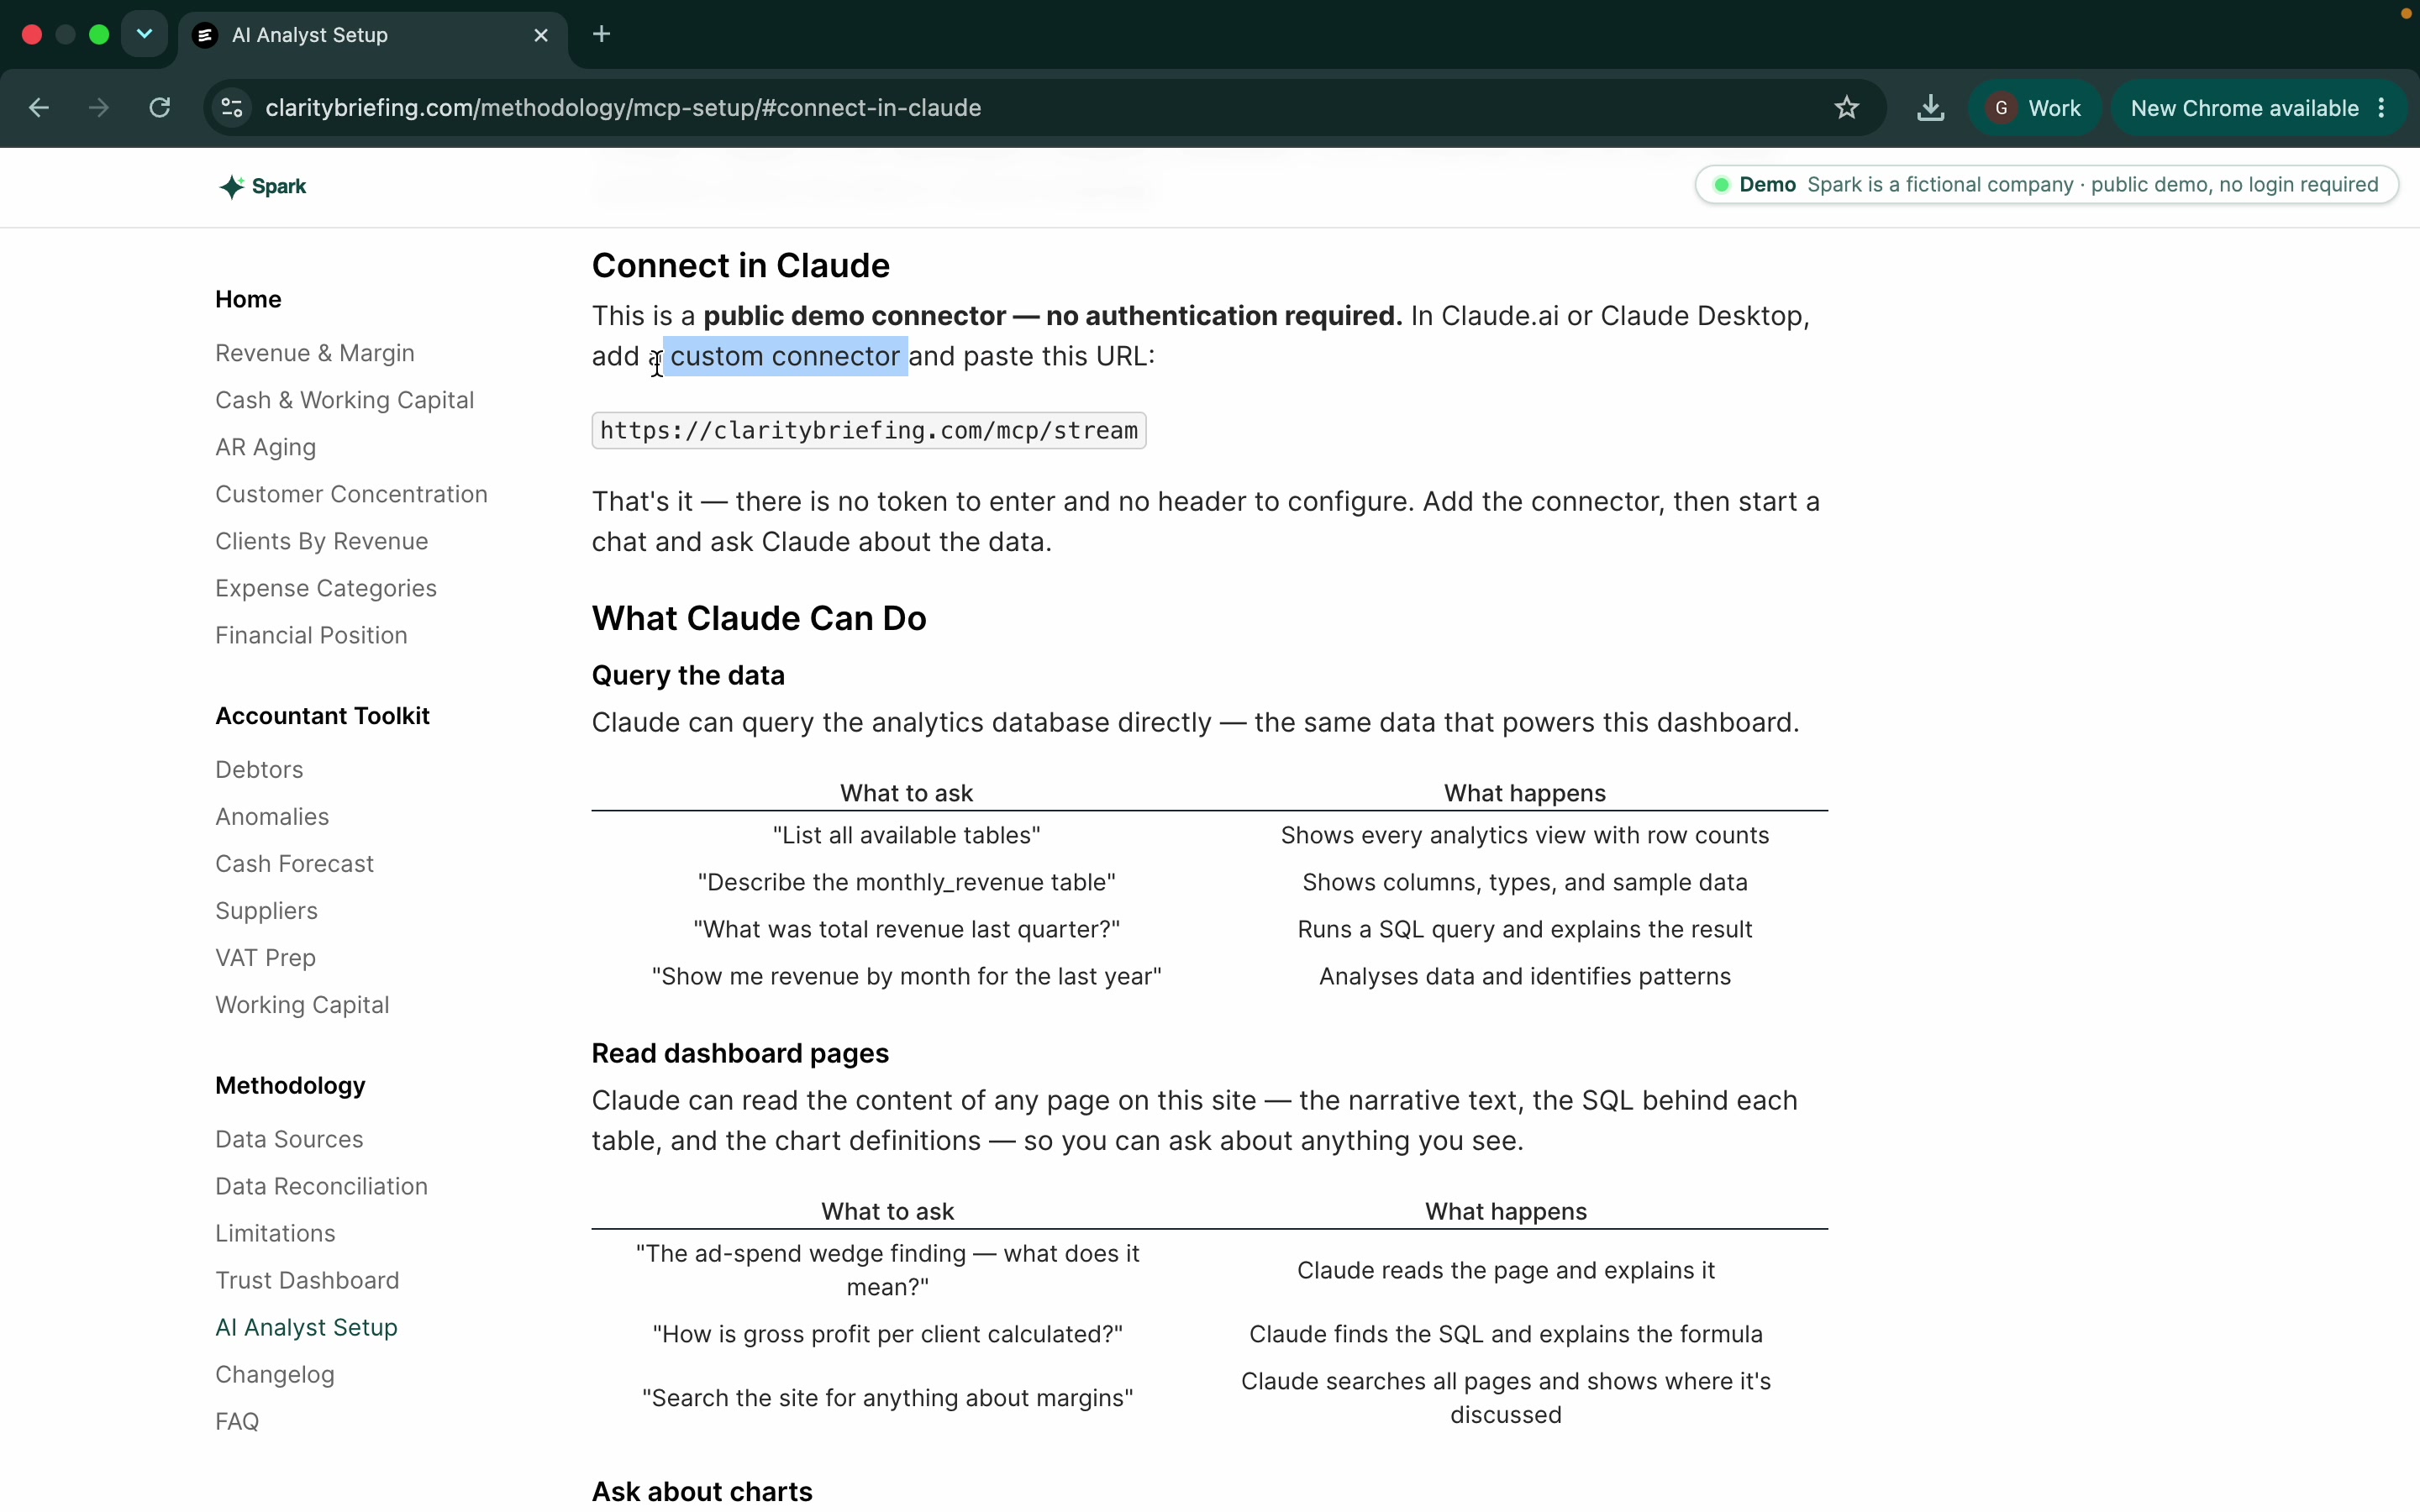
To ask your numbers questions, you point Claude at your data with a single connector link. Paste the URL, click connect, and start asking. The public demo needs no sign-in; your own connection is private to you.
Literally just throw this URL in, click connect.
Have a look, then we'll talk.
When it makes sense, book a call and we will set it up with your accountant.