How it works
The short version, in plain terms. Clarity reads your accounting data, turns it into a clear dashboard, and lets you ask questions of the same numbers. If you want the technical detail, the pipeline page traces a figure all the way back to its source.
It reads your books, and never writes to them
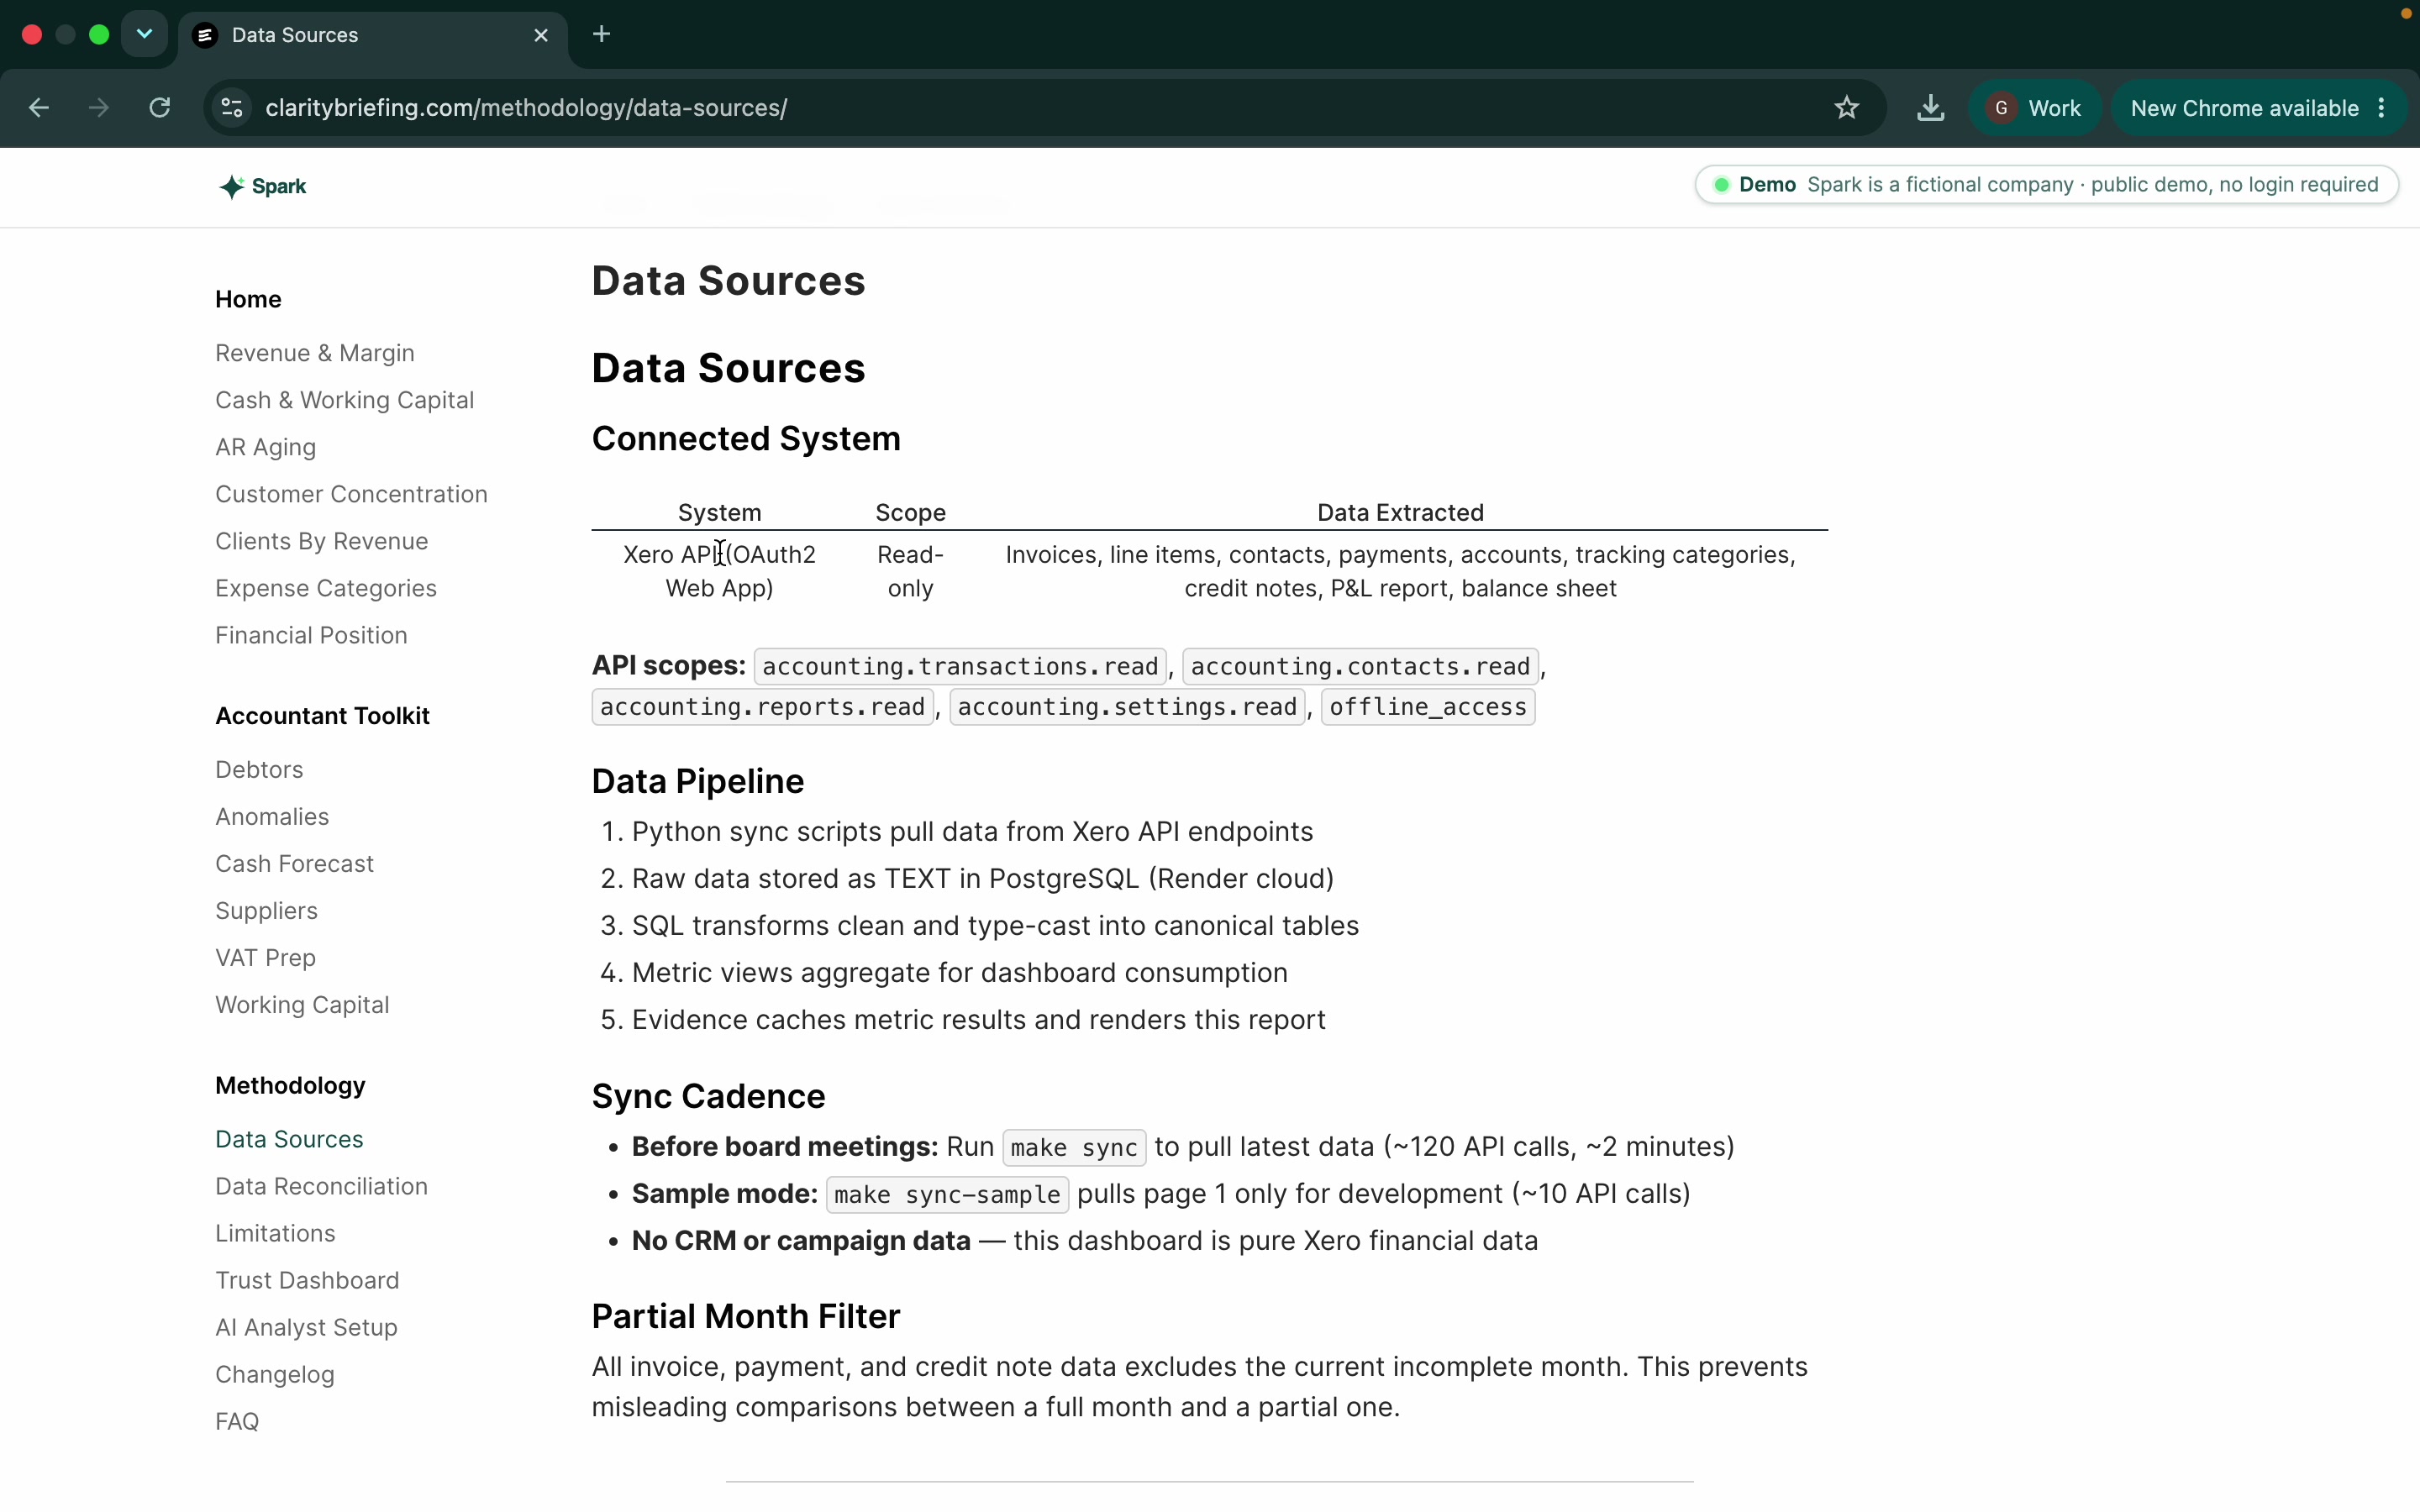
You connect your accounting system with read-only access. Clarity copies that data into its own environment to work on. It does not create, change, or delete anything in your accounts. Your accounting system stays the record of truth.
We don't write anything to Xero, other than siphoning it off into our own environment.
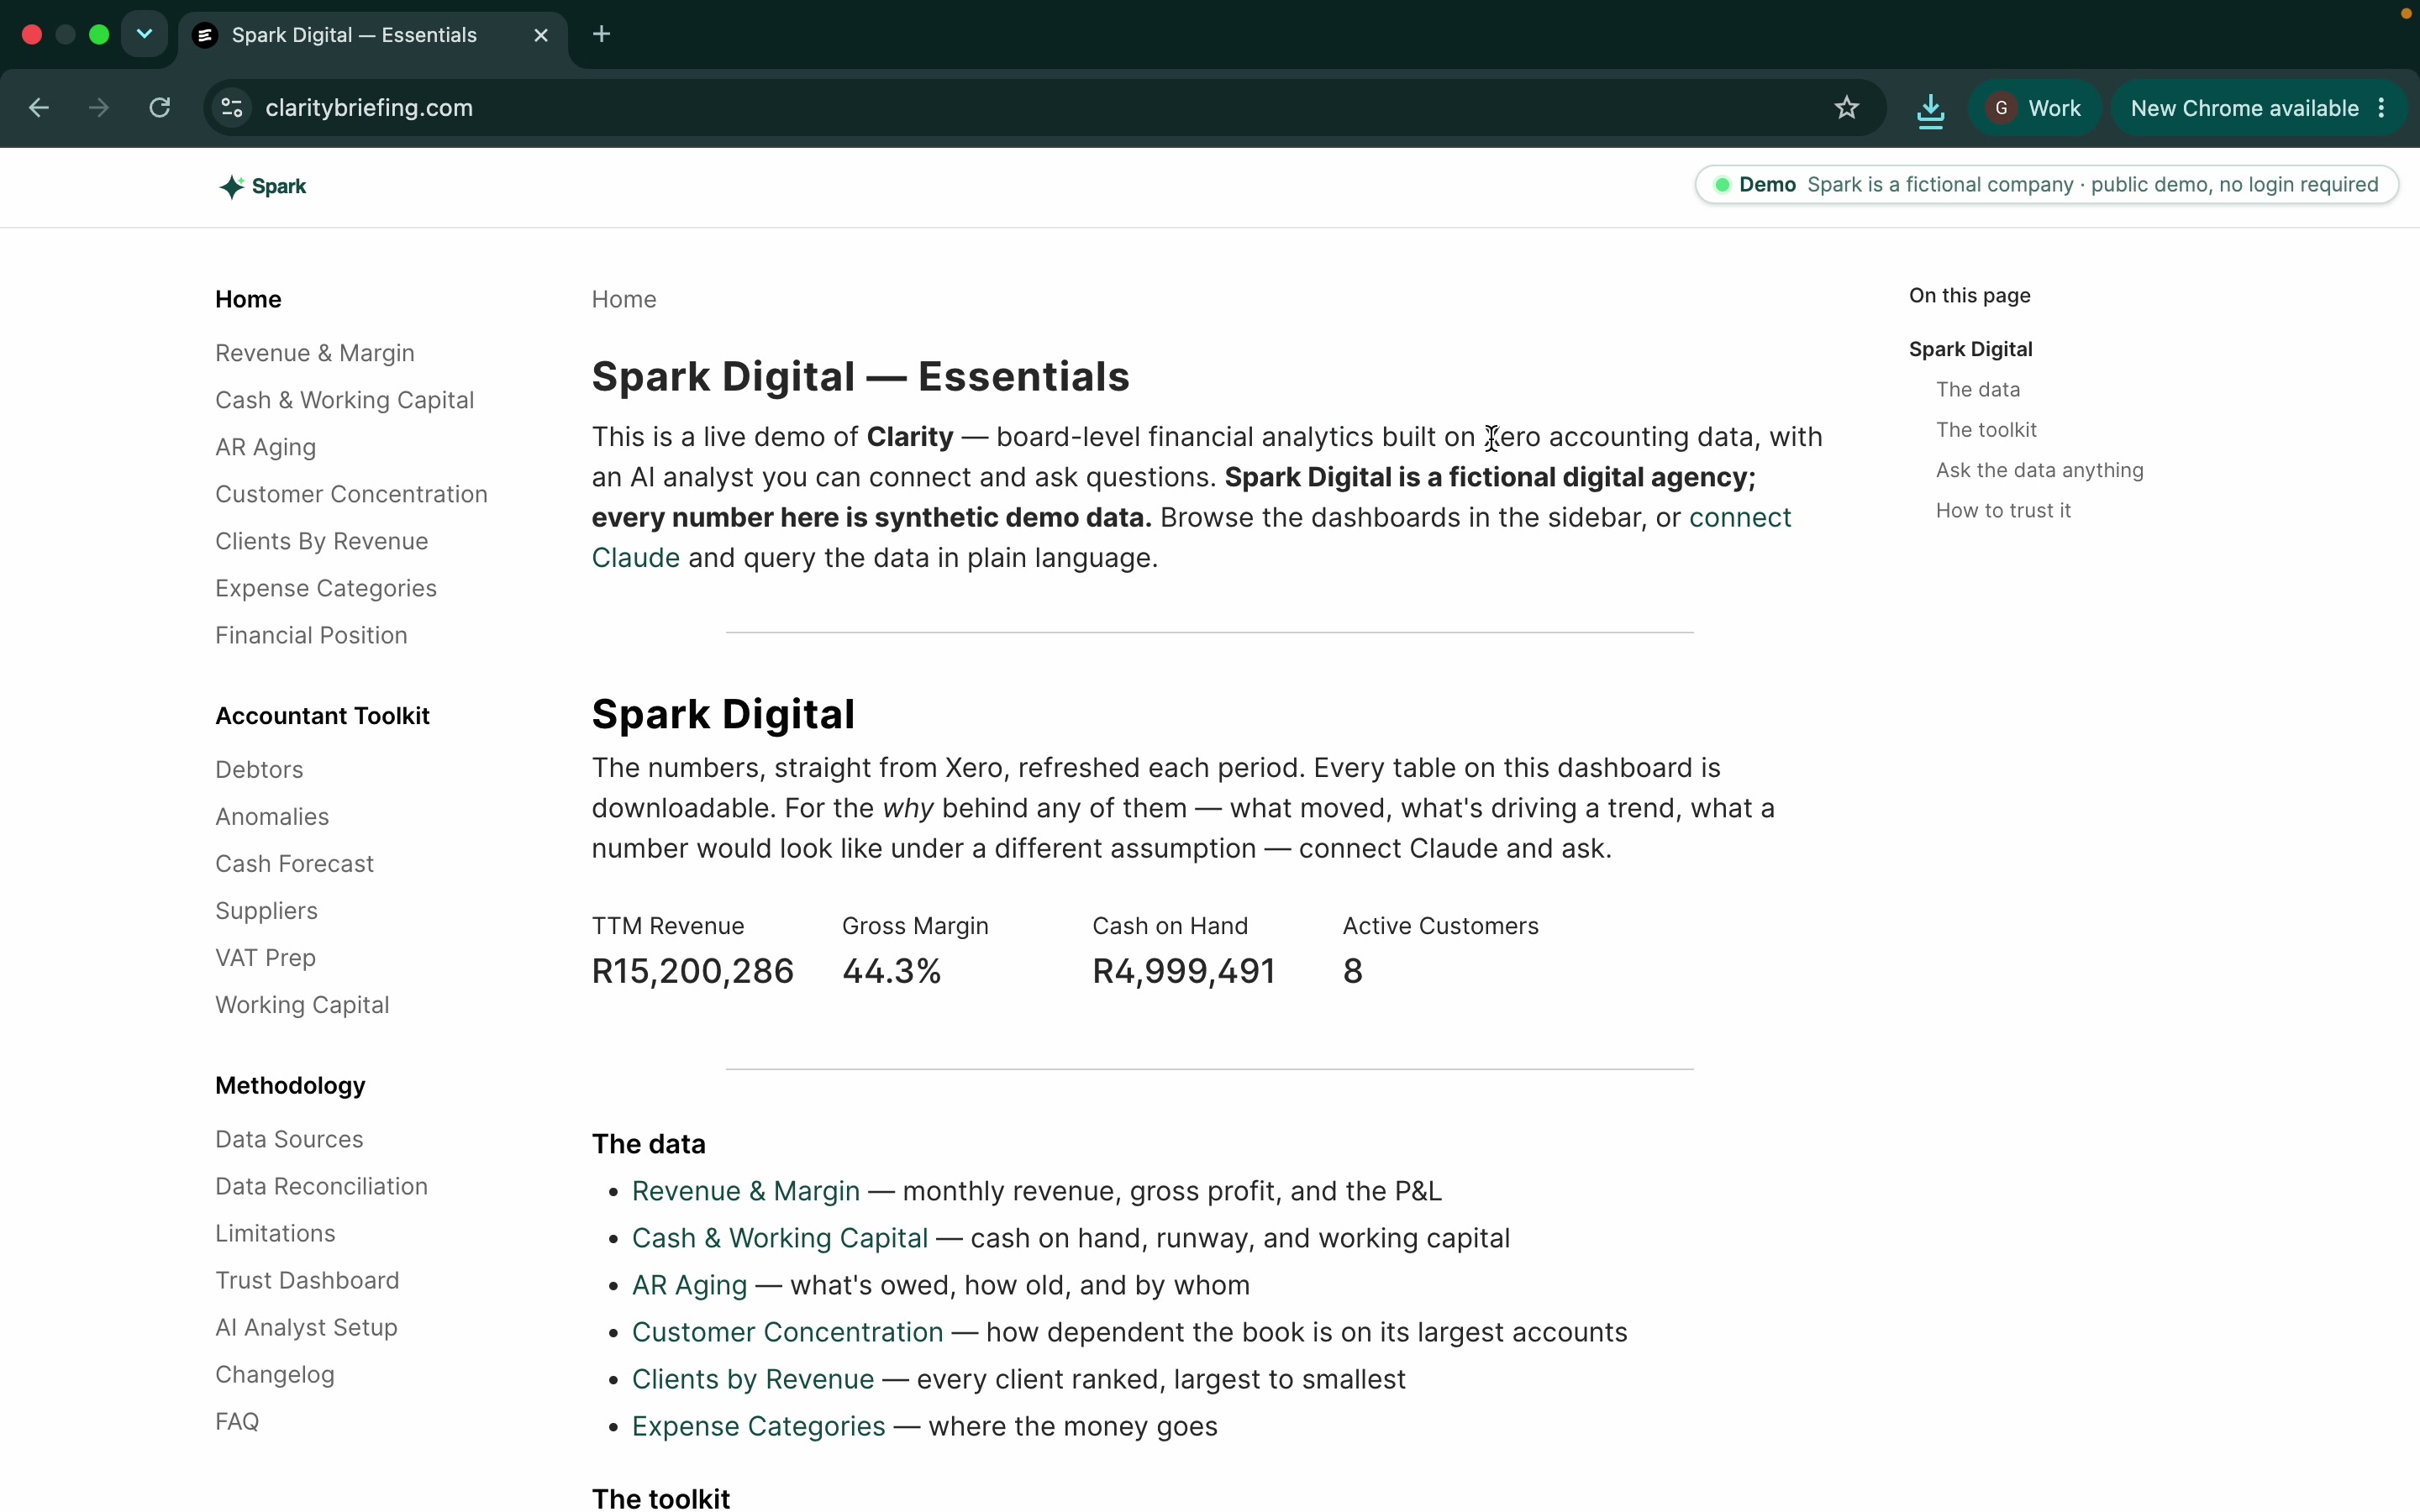
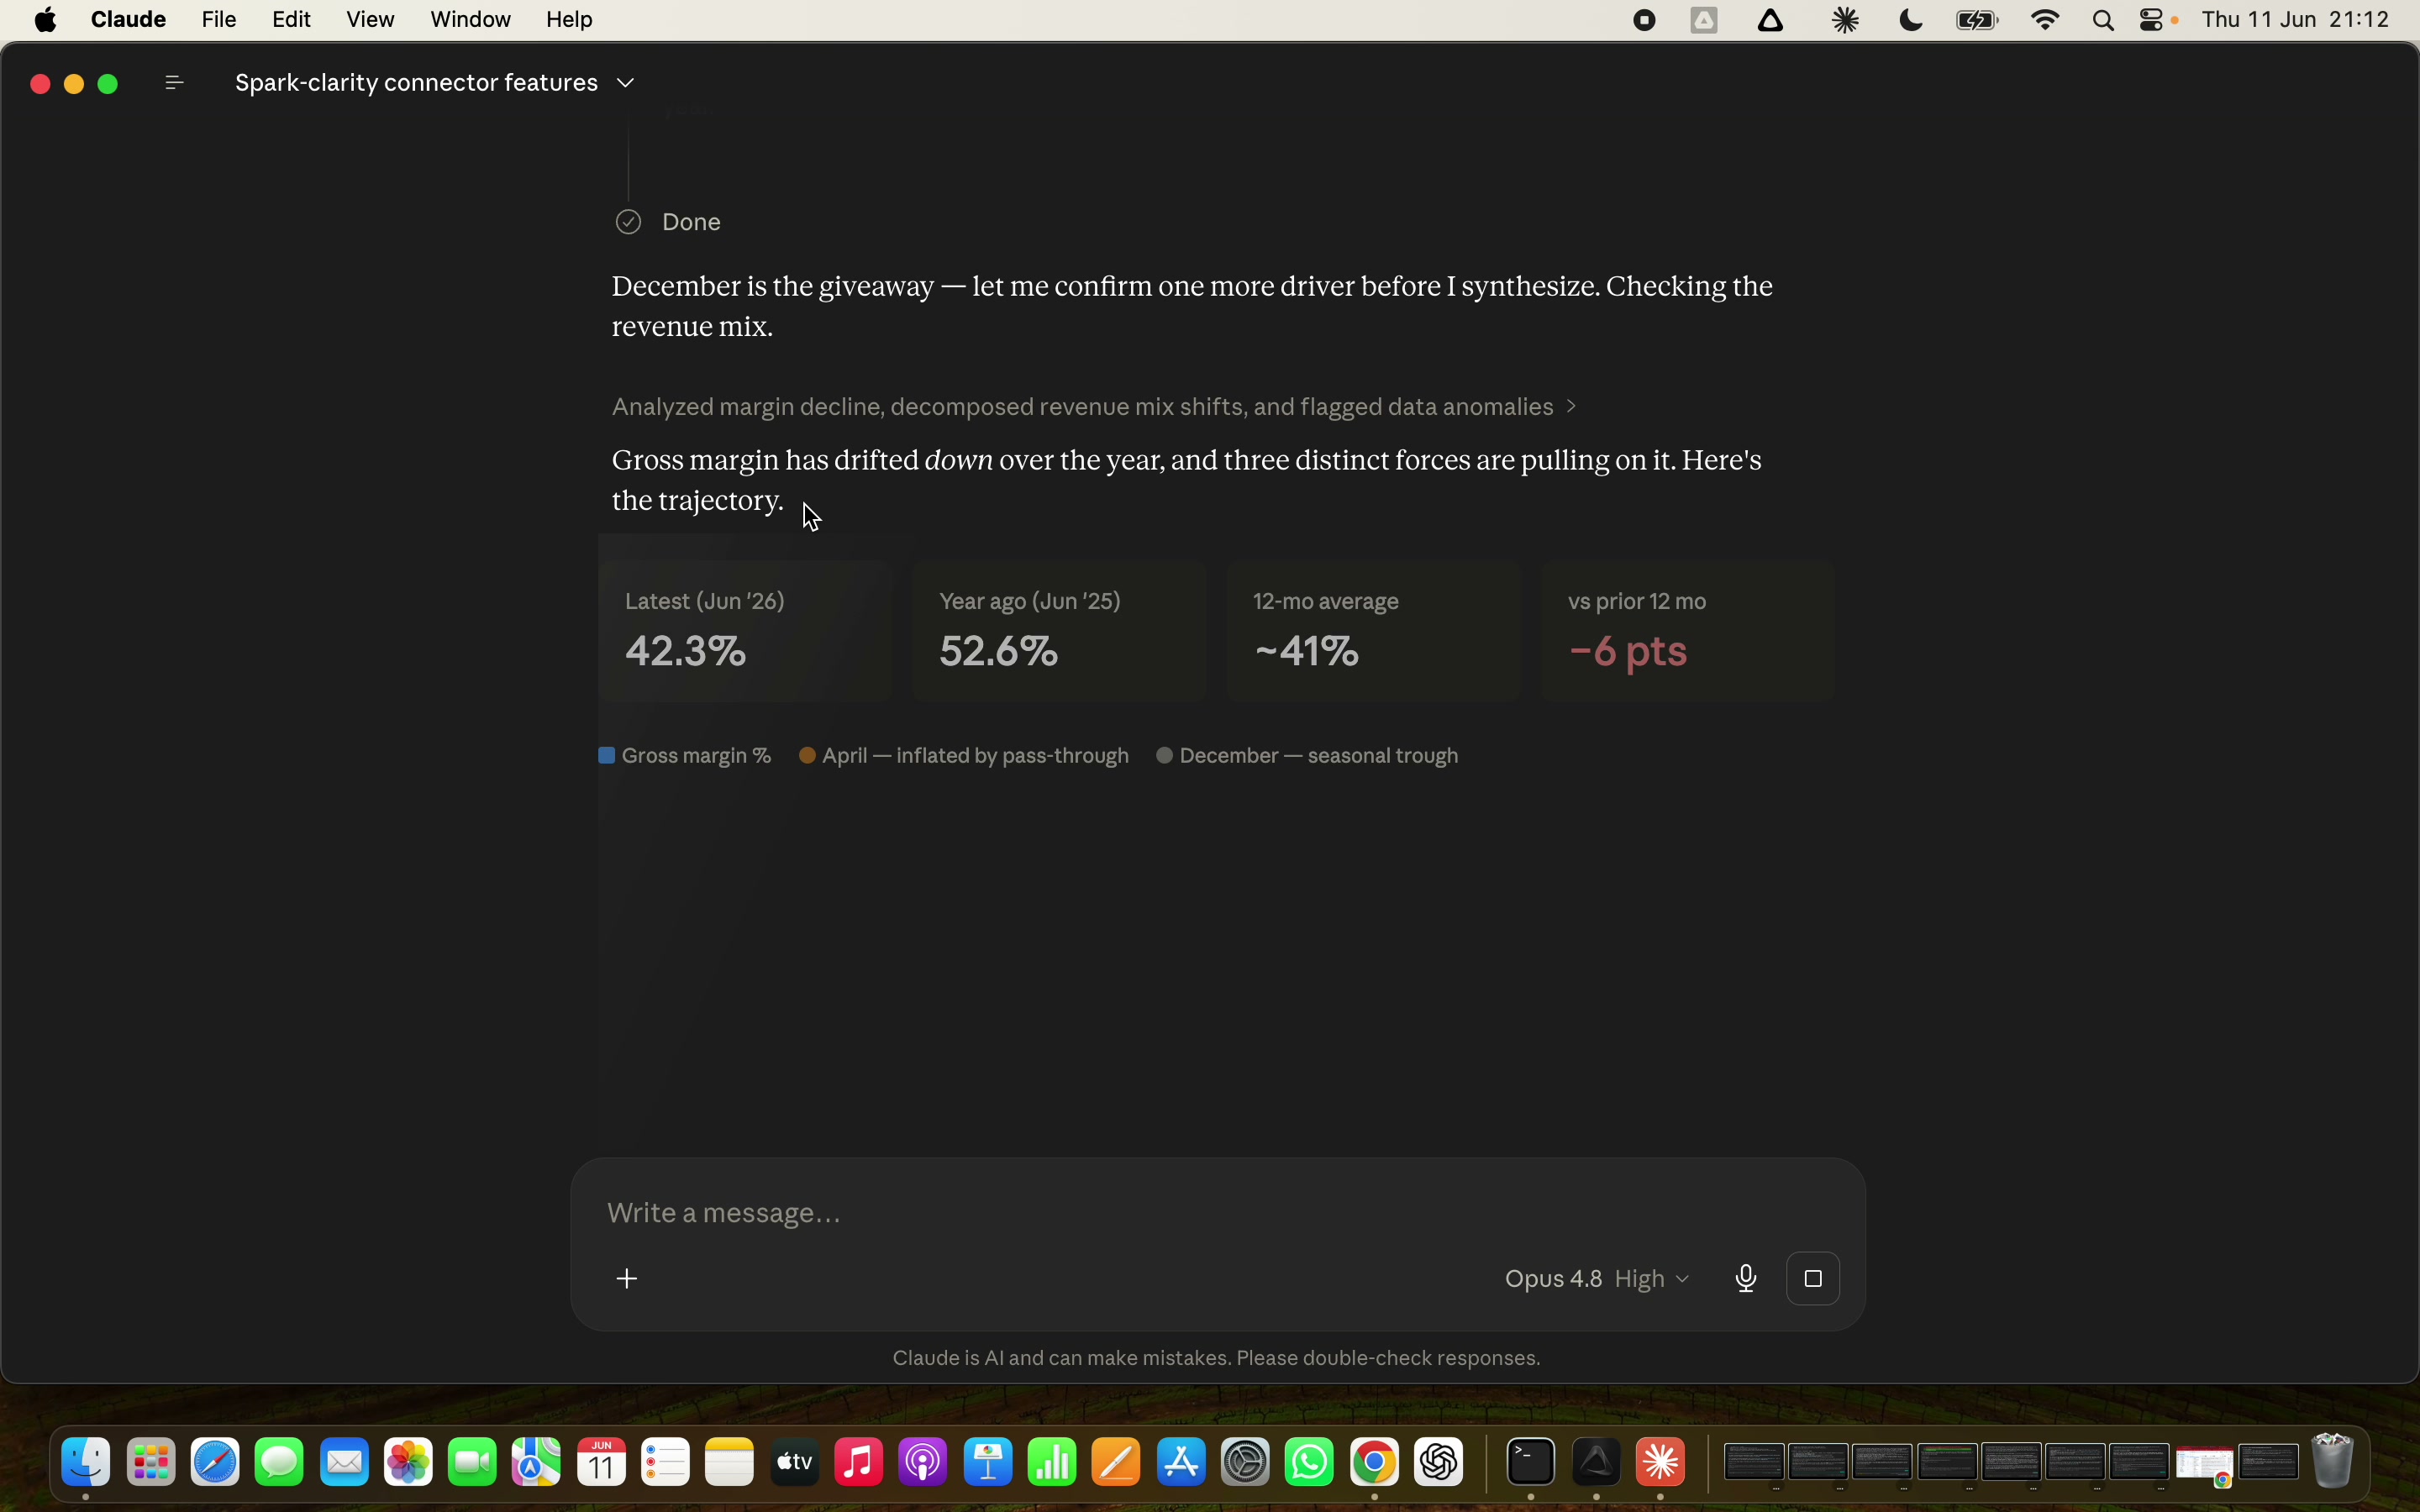
Two ways to see the same data
The first is a dashboard you read like a board pack: revenue, margin, cash, who owes you what. The second is an AI analyst you talk to when you want to dig into something the dashboard does not spell out. Both sit over the same numbers.
Clarity exposes your financial data in two ways. The one is a dashboard, and the other is that it makes it available to your AI.
It refreshes each month-end
When your books close for the month, the dashboard refreshes. Unfinished months are held back so a half-recorded month cannot distort the picture, and the dashboard shows how fresh the data is. The figures are plain calculations on your data, and revenue is reconciled against your accounting system’s own report.
For the full pipeline, the way every figure traces to its source, and how the AI is kept read-only, see Security.